MotilA – A Python pipeline for the analysis of microglial fine process motility in 3D time-lapse multiphoton microscopy data
Published in: Journal of Open Source Software, 2025
Type: Journal Article
Citation
Fabrizio Musacchio, Sophie Crux, Felix Nebeling, Nala Gockel, Falko Fuhrmann, Martin Fuhrmann, "MotilA – A Python pipeline for the analysis of microglial fine process motility in 3D time-lapse multiphoton microscopy data" (2025). Journal of Open Source Software, 10(116), 9267 https://doi.org/10.21105/joss.09267


![]()
![]()


Abstract
MotilA is a Python-based image analysis pipeline for quantifying fine process motility of microglia from 3D time-lapse two-channel fluorescence microscopy data. Developed for high-resolution multiphoton in vivo imaging datasets, MotilA enables both single-file and batch processing across multiple experimental conditions. It performs image preprocessing, segmentation, and motility quantification over time, using a pixel-based change detection strategy that yields biologically interpretable metrics such as the turnover rate (TOR) of microglial fine processes. While originally designed for microglial imaging, the pipeline can be extended to other cell types and imaging applications that require analysis of dynamic morphological changes. MotilA is openly available, platform-independent, and includes extensive documentation, tutorials, and example data to facilitate adoption by the broader scientific community. It is released under the GPL-3.0 open-source license.
MotilA pipelineꜛ’s segmentation and microglial turnover rate assessment. This animation illustrates the structural changes that MotilA detects and quantifies. The left panel shows one representative Z-slice per time point after MotilA’s internal preprocessing steps. The right panel shows the corresponding $\Delta B$ classification maps, which are computed as difference images between two consecutive time points $t_i$ and $t_{i+1}$.
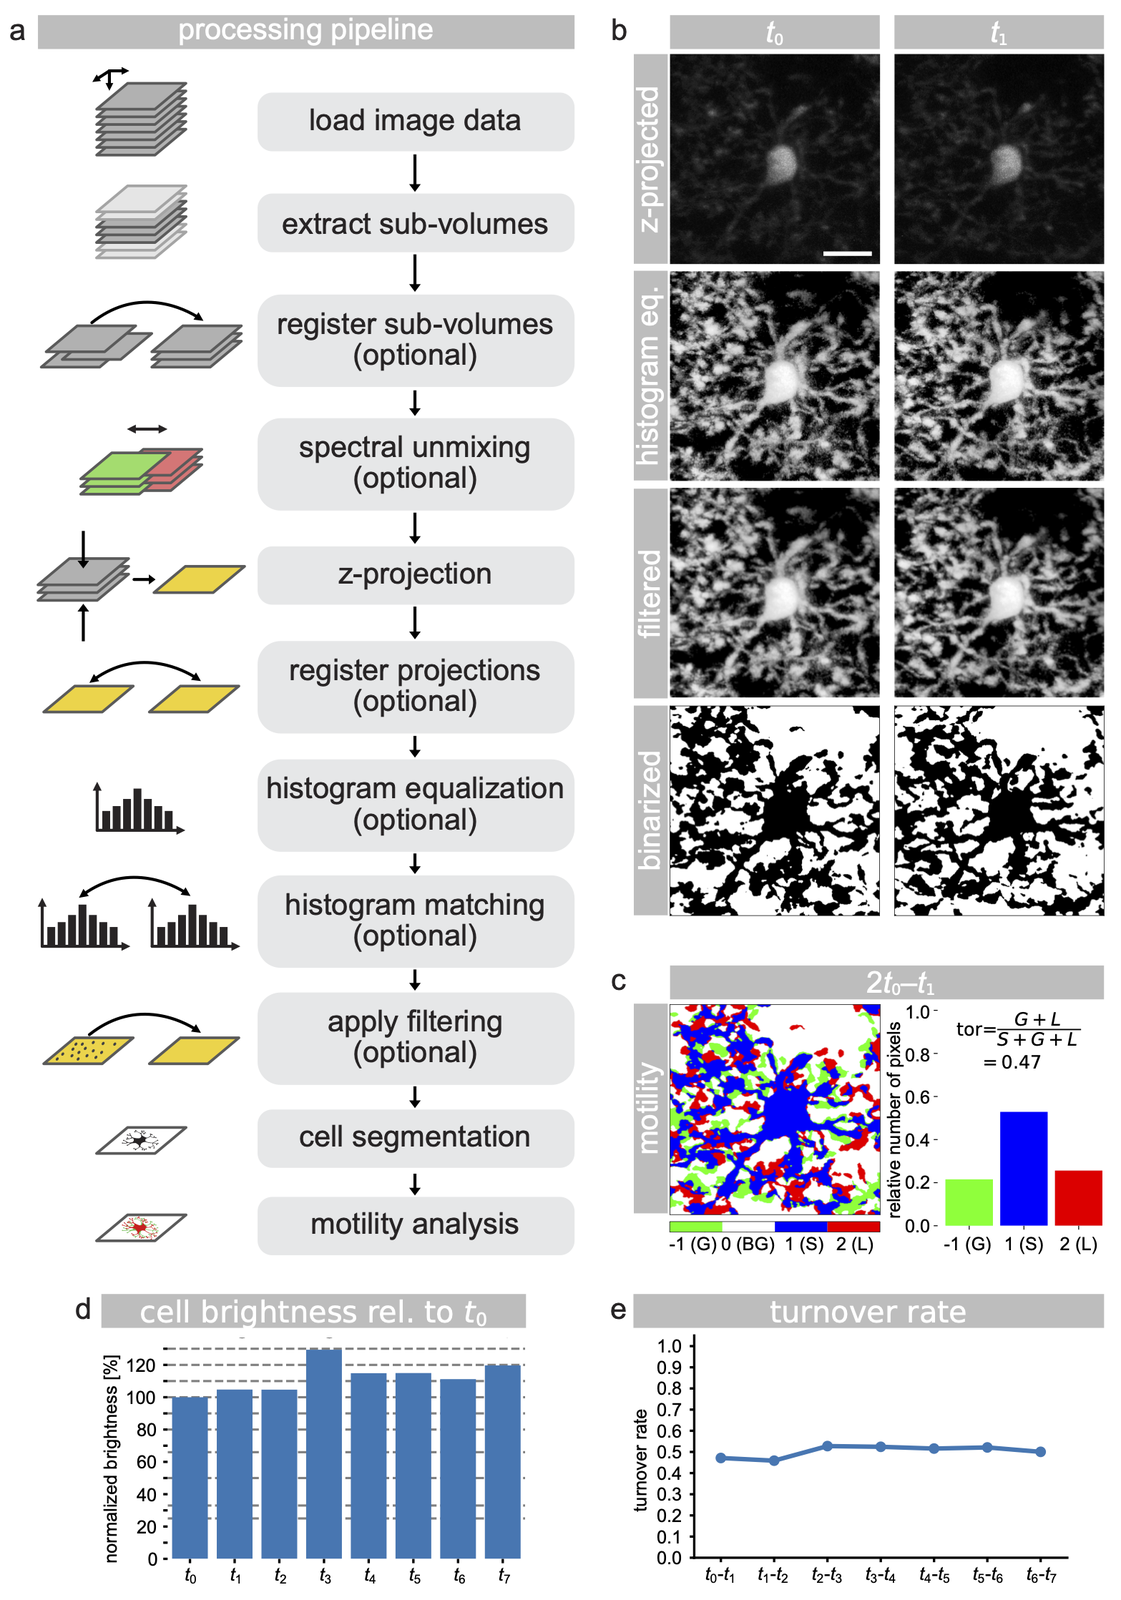
Step-by-step illustration of the MotilA pipelineꜛ using the included test dataset. a) Overview of the image processing pipeline, showing core and optional steps. b) Example projections of a cropped microglial cell at time points $t_0$ and $t_1$, including raw, histogram-equalized, filtered (median and Gaussian), and binarized versions. c) Binarized pixel-wise comparison between $t_0$ and $t_1$, with classification into stable (S, blue), gained (G, green), lost (L, red), and background (BG, white) pixels, along with the corresponding pixel statistics. d) Normalized cell brightness over time, relative to $t_0$, used to assess bleaching and signal stability. e) Turnover rate (TOR) plotted across all time points for the same cell, representing process-level motility dynamics. All microglial image panels in b and c are shown at the same scale. Scale bar in the top-left image of panel b represents 10 μm.
comments