Image segmentation and feature extraction
If you haven’t installed Napari yet, please do so before proceeding with this tutorial. To practice this tutorial, install the following package(s) in your activated Napari conda environment:
mamba install -y napari-assistant napari-simpleitk-image-processing
What is image segmentation?
Image segmentation is a process that involves dividing an image into meaningful and distinct regions or objects such as cells, cell components, tissue, and so on. It plays a crucial role in image analysis as, by segmenting an image, we can extract valuable information about the objects present, their boundaries, and their spatial relationships. This information is generally referred to as features and the extraction process as feature extraction. The extracted features can than be used for further analysis, such as object classification, object tracking, and object counting, and so on.
One technique to segment an image is image binarization, which converts an image into a binary format, typically consisting of black and white pixels. Binarization simplifies image analysis by segmenting the image into foreground and background regions based on a specific criterion. Global thresholding, a common binarization technique, determines a single threshold value to separate the foreground from the background by considering the overall pixel intensity distribution. This approach is suitable for images with well-defined intensity characteristics.
Semantic segmentation, a specific type of image segmentation, goes beyond simple boundary detection and assigns semantic labels to each pixel, enabling precise understanding of the image’s content. Semantic segmentation is usually performed using deep-learning techniques such as convolutional neural networks (CNN), that can learn complex hierarchical features from vast amounts of labeled data. By training these models on annotated images, they can effectively segment objects in unseen images based on learned patterns and contextual information.
In this tutorial we will focus on global thresholding methods for image binarization and feature extraction. The subsequent chapter will than cover semantic segmentation using deep-learning techniques.
Global thresholding
Global thresholding methods are commonly used techniques for image segmentation, specifically in situations where a single threshold value can effectively separate foreground objects from the background. These methods assume that there is a clear intensity difference between the foreground and background regions in the image.
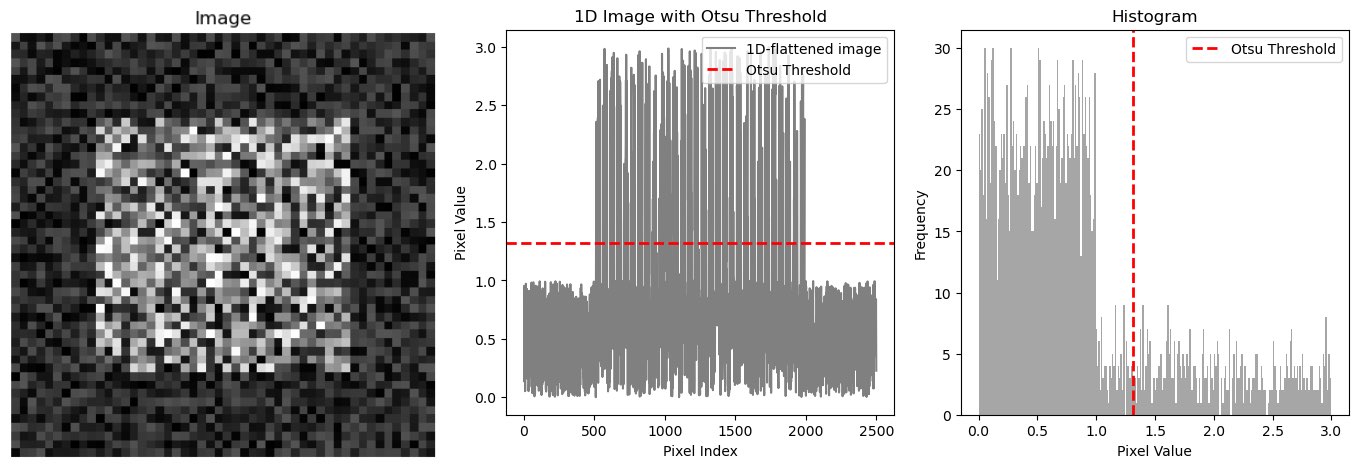 Demonstration of global thresholding. Left: An artificial image with a clear intensity difference between the foreground (center square) and the background. Middle: The same image, just 1D-flattened, plotted together with an estimated global threshold (red line; calculated with Otsu’s method, see below), which separates the foreground from the background. Right: The histogram of the image together with the estimated global threshold. The code to generate these plots is available in the GitHub repository of this course.
Here are some common global thresholding methods:
- Otsu’s method calculates an optimal threshold by maximizing the between-class variance of the pixel intensities. It determines the threshold that minimizes the intra-class variance while maximizing the inter-class variance. Otsu thresholding is widely used and effective when there is a bimodal distribution of pixel intensities. Otsu’s method may not perform well for images with uneven lighting or complex distributions.
- Triangle thresholding computes a threshold based on the triangle-shaped histogram distribution. It determines the threshold where the cumulative sums of the pixel intensities on both sides of the threshold are equal. Triangle thresholding is simple and effective, particularly for images with well-defined foreground and background regions.
- Li’s method calculates an optimal threshold by maximizing the between-class variance. It uses a modified version of Otsu’s method that considers the imbalance of the histogram distribution. Li thresholding is known to perform well on images with uneven lighting conditions, but it ist sensitive to noise and may struggle with complex distributions.
- Yen’s method computes an optimal threshold by maximizing the entropy of the pixel intensities. It calculates the threshold that maximizes the information gain between the foreground and background regions. The method is well-suited for images with varying background intensities, but can be sensitive to noise and may not handle complex distributions.
- Mean thresholding sets the threshold as the average intensity of the image. It calculates the mean intensity of all the pixels and separates them into foreground and background based on this threshold. Mean thresholding is straightforward but may not be as effective if the image has significant variations in lighting or intensity.
- Minimum thresholding calculates the threshold by selecting the minimum intensity value from the image. It sets all pixels with intensities below the threshold to the background, and those above or equal to the threshold to the foreground. Minimum thresholding is a simple and straightforward method that can be useful when the image has a distinct intensity gap between the foreground and background, but may not handle images with complex or uneven intensity distributions.
- Isodata thresholding is an iterative method that computes the threshold by updating it based on the mean intensities of the foreground and background regions. It converges when the threshold value stabilizes. Isodata thresholding is commonly used for image segmentation and is effective when the image histogram is multi-modal or has uneven illumination.
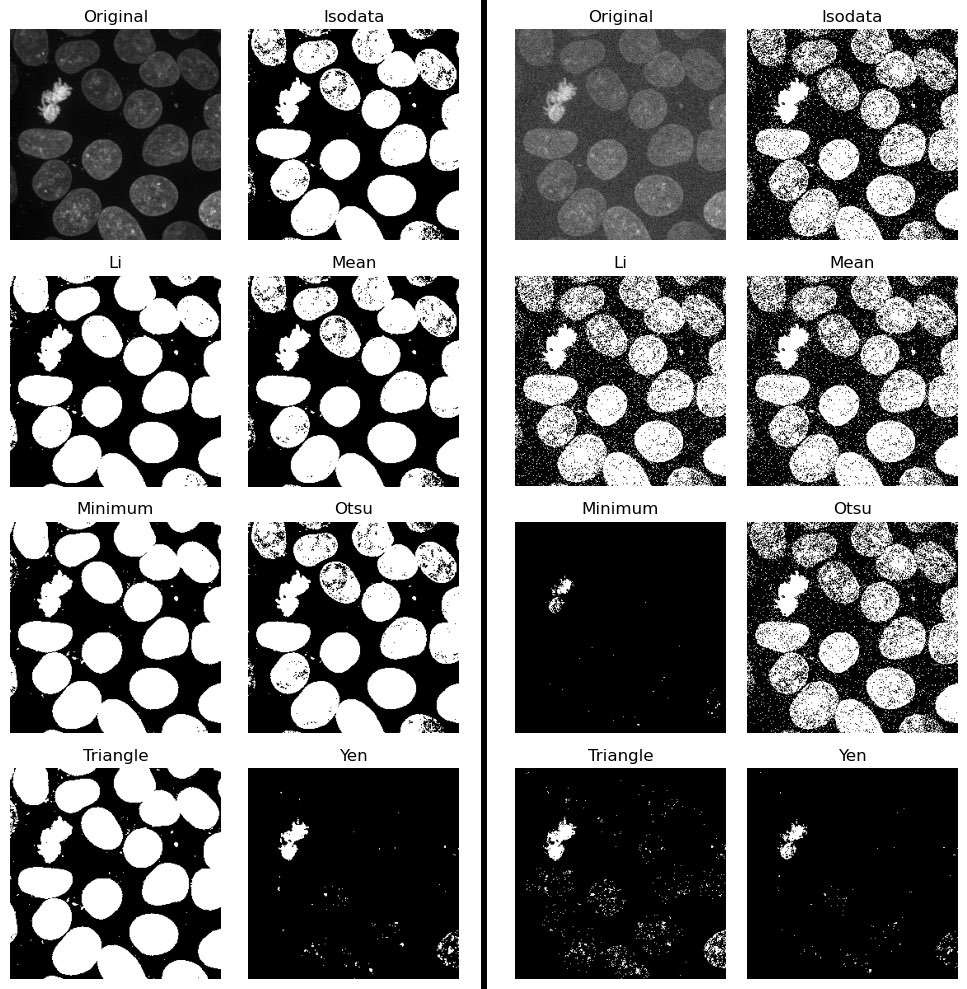 Comparison of global thresholding methods, namely IsoData, Li, Mean, Minimum, Otsu, Triangle and Yen. Left panel: Applied to the “Cells (3D+2Ch)” sample image. Right panel: Applied to the same image, but after adding some random noise. The code to generate these plots is available in the GitHub repository of this course.
Applying global threshold methods in Napari
Image segmentation using global threshold methods in Napari is, again, pretty simple and all relevant functions come along with the napari-simpleitk-image-processingꜛ plugin. The first step includes the binarization of the image using a global thresholding method. The plugin provides more binarization functions than the ones described above. You can find a brief description for all of them hereꜛ. The thresholding functions can be found in the Tools->Segmentation / binarization menu. Choose one of the functions provided to open the corresponding widget. Note, that each method has its own widget, thus, there is no all-in-one thresholding widget. Each widget allows you to select the layer you’d like to binarize. The binarization can be performed both on 2D and 3D images:
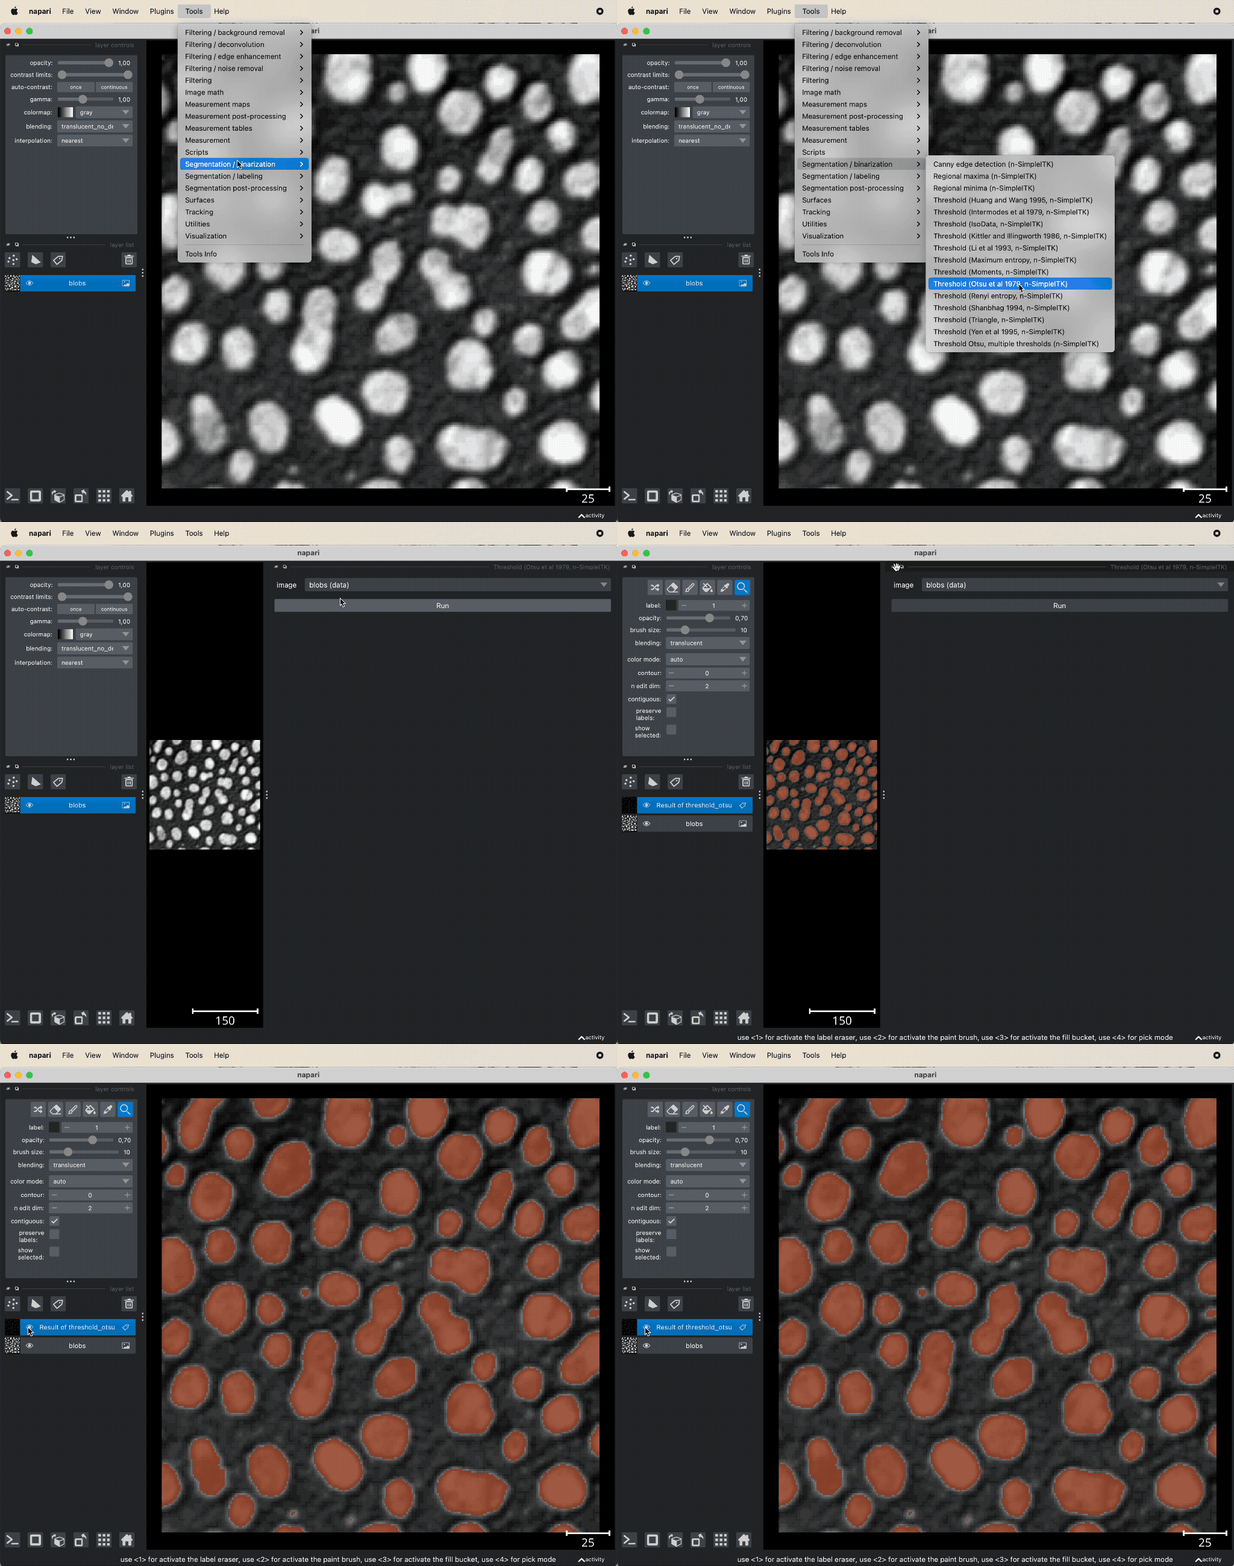 Image thresholding in Napari using the napari-simpleitk-image-processing plugin. Otsu’s method is applied to the 2D image “blobs_clesperanto” from GitHub data folder (the file is originally from the py-clesperanto sample datasetꜛ, see image credits in the acknowledgements section below).
In some cases it might be necessary to apply the Binary fill holes from the Tools->/Segmentation post-processing menu to fill holes in the thresholded layer, which may occur due to noise or artifacts in the original image. For noisy images it is also recommended, to apply a noise reduction filter in advance.
Relabeling
The thresholded layer gives us so far just a mask of labels, whose values are all 1. Since we have spatially separated entities (cells) within the image, we want to be able to distinguish them from each other. This can be achieved, e.g., by using the watershed algorithm or a connected component analysis. The according functions can be found in the Tools->Segmentation / labeling menu. The connected component analysis (Connected component labeling) re-labels the thresholded layer in such a way, that all spatially separated object get a unique label:
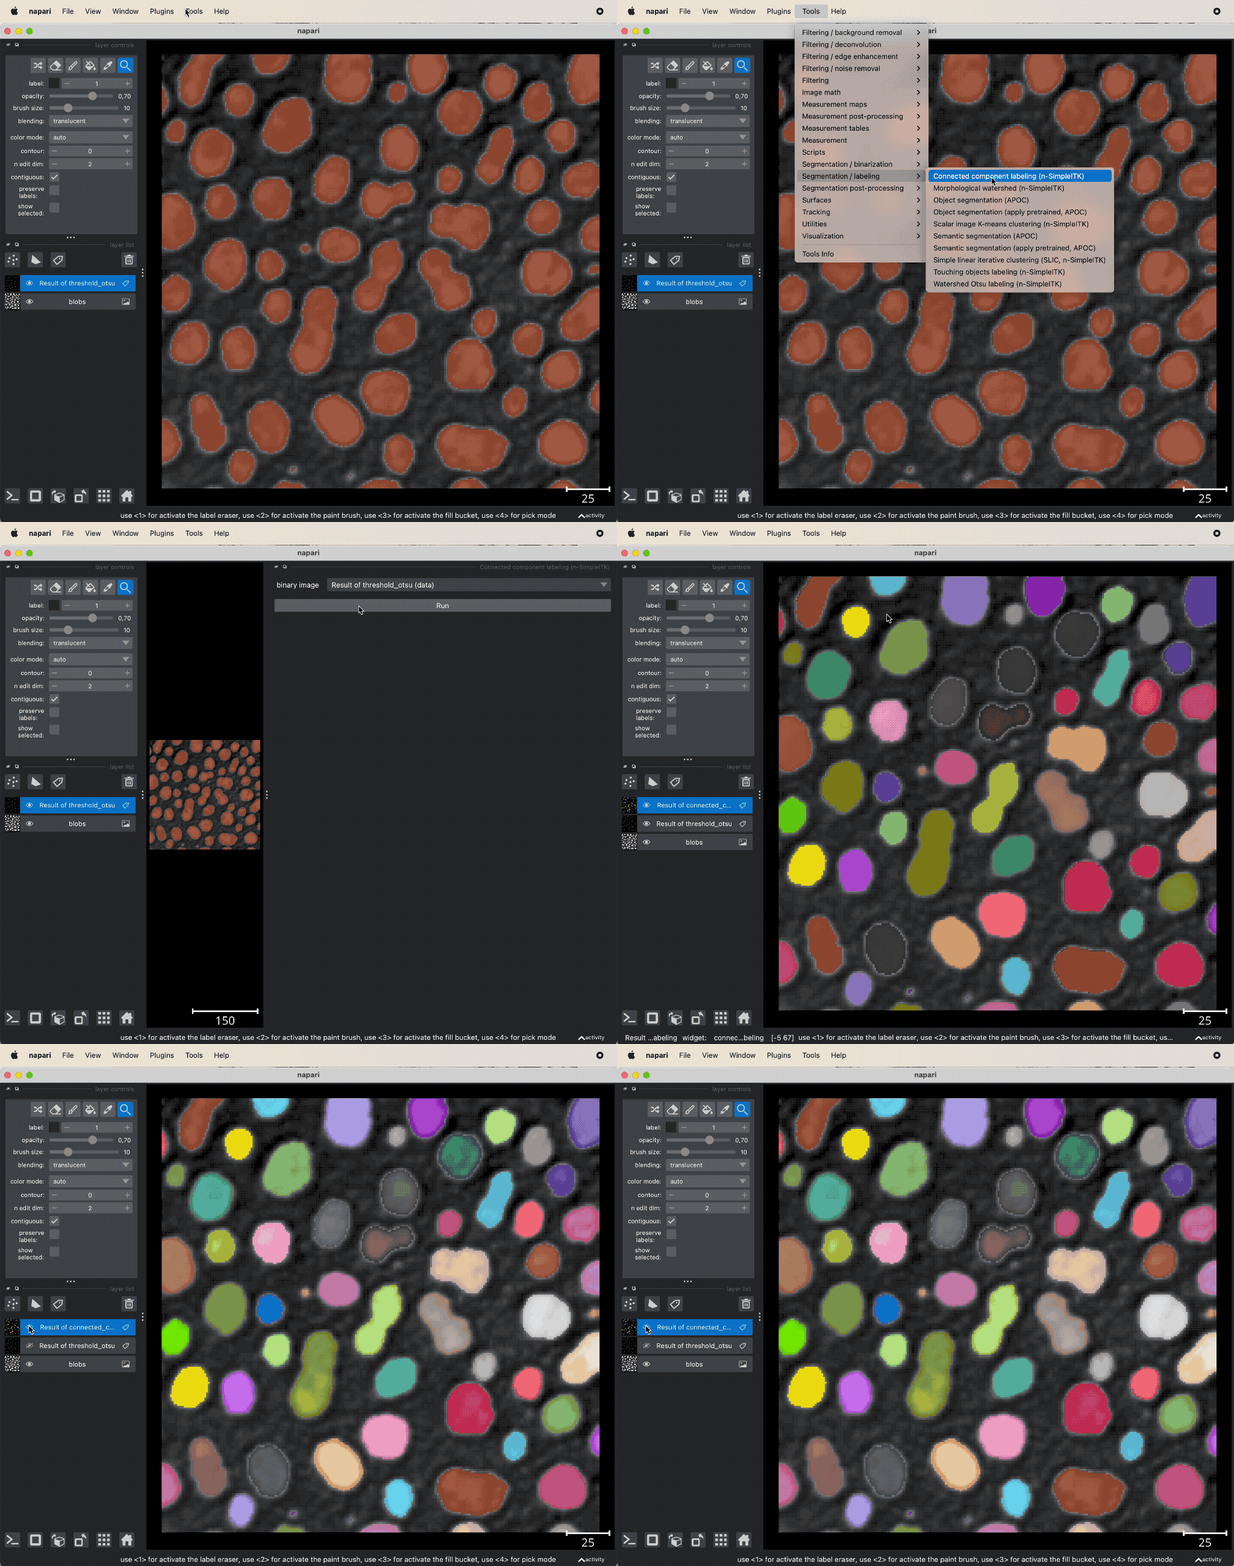 Example of connected component analysis on the thresholded layer.
Feature extraction
What do we gain from the thresholding? Well, we have created a layer, that serves as a “cut-out” mask for the actual image. It contains individual labels for the relevant (i.e., “desired”) information (e.g., cells) within the underlying image, which helps us to separate the relevant image parts from the non-relevant (i.e., “unwanted”) information (e.g., background). The extracted, i.e., segmented relevant image parts can than be further assessed, e.g., by calculating their area, volume, location, brightness, density, and so on. To do so, we need to “measure” the segmented image parts. This can be achieved by executing, e.g., the Measurements function from the Tools->Measurement tables menu. As a result, we get a feature table for each object. This table can be copied to the clipboard or saved as a CSV file for further analysis:
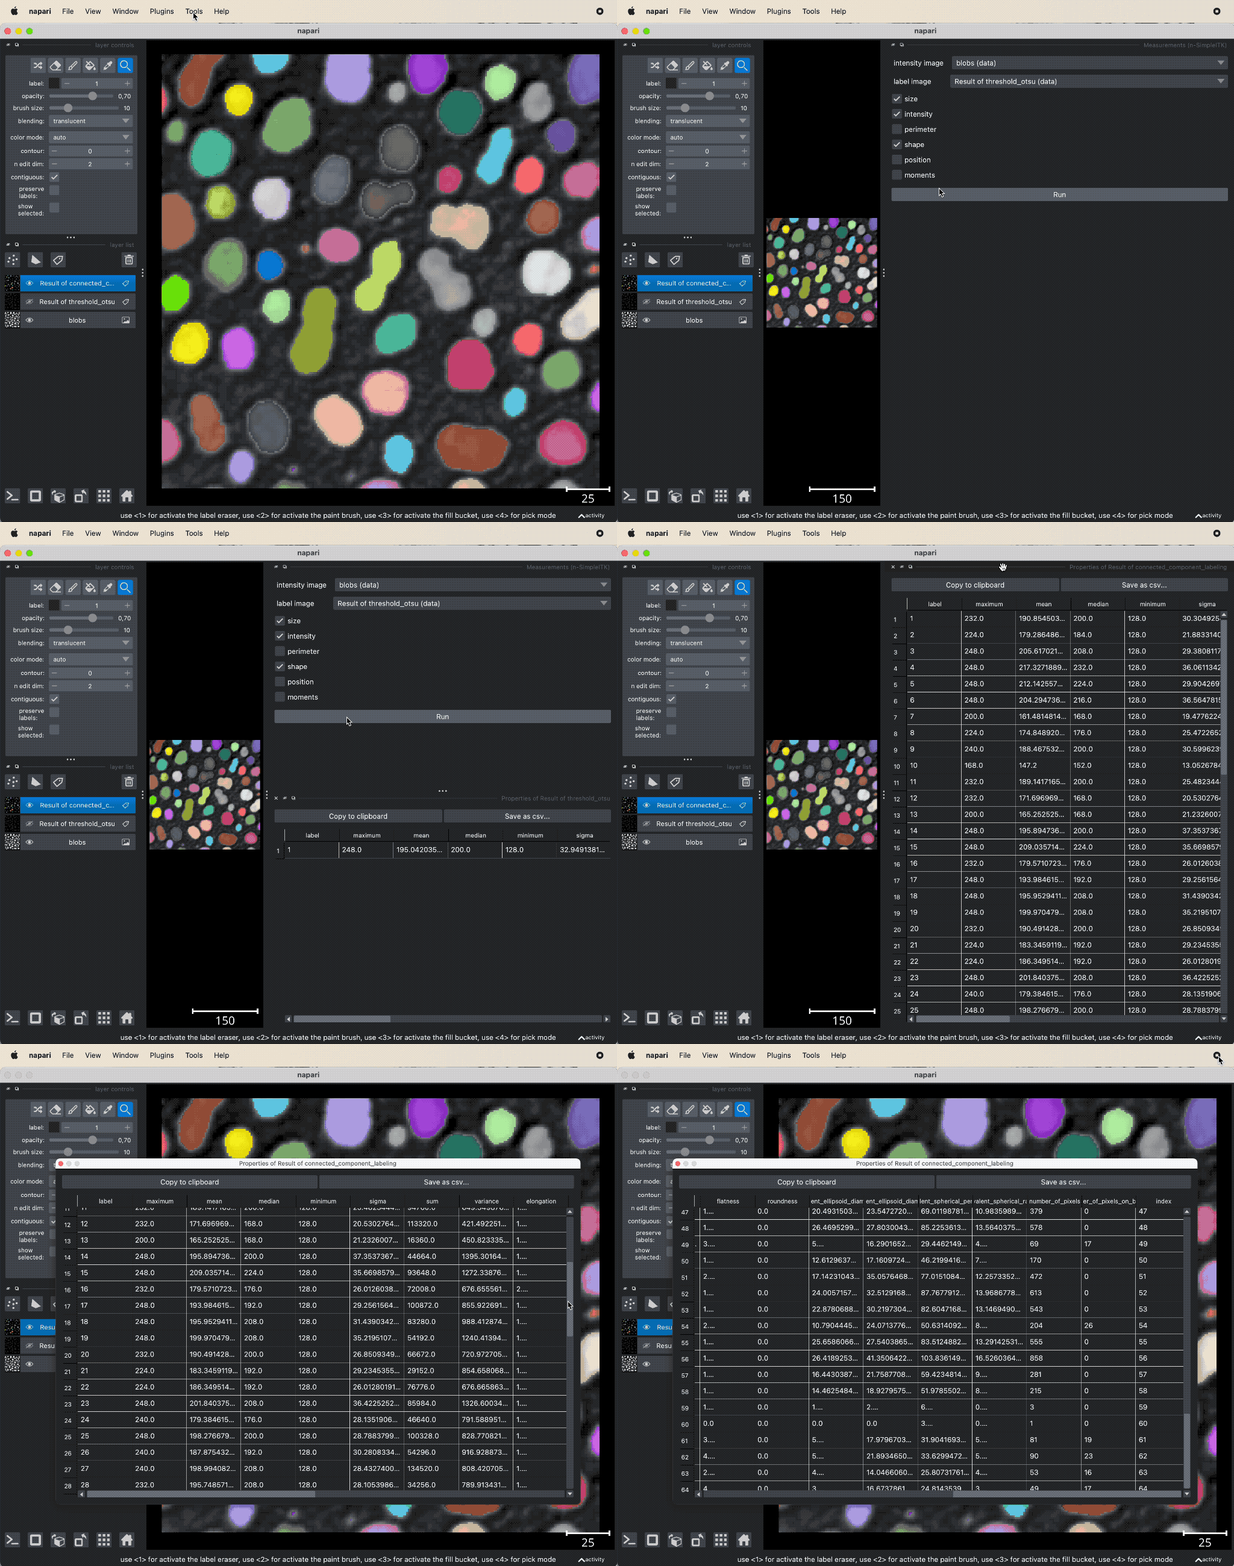 Measuring the segmented cells.
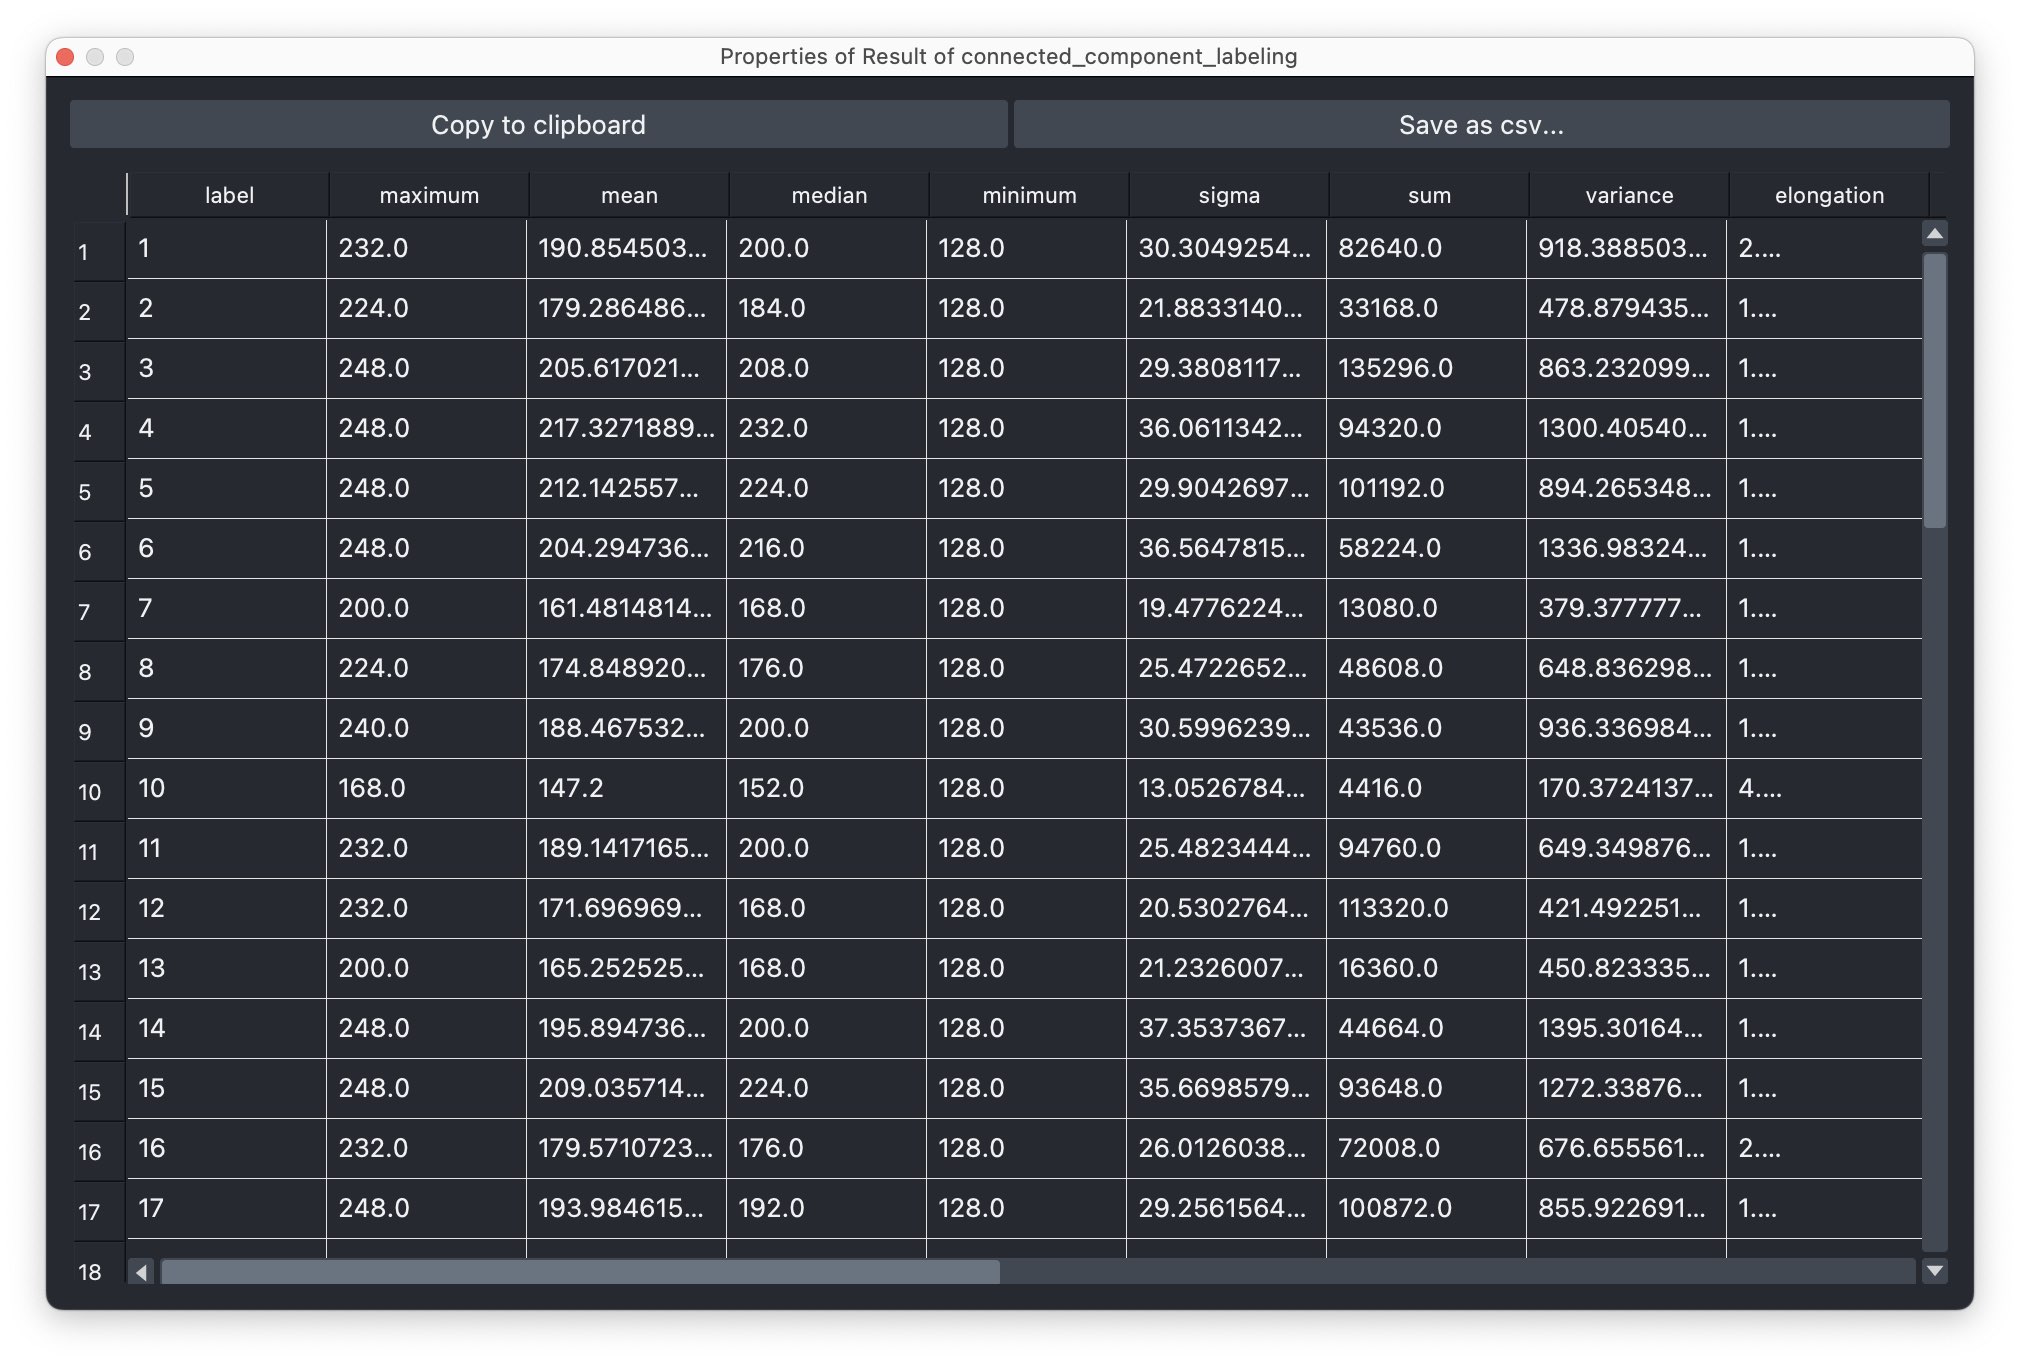 Feature table of the extracted properties for each segmented cell.
Improving the segmentation
Let’s apply the segmentation to another dataset:
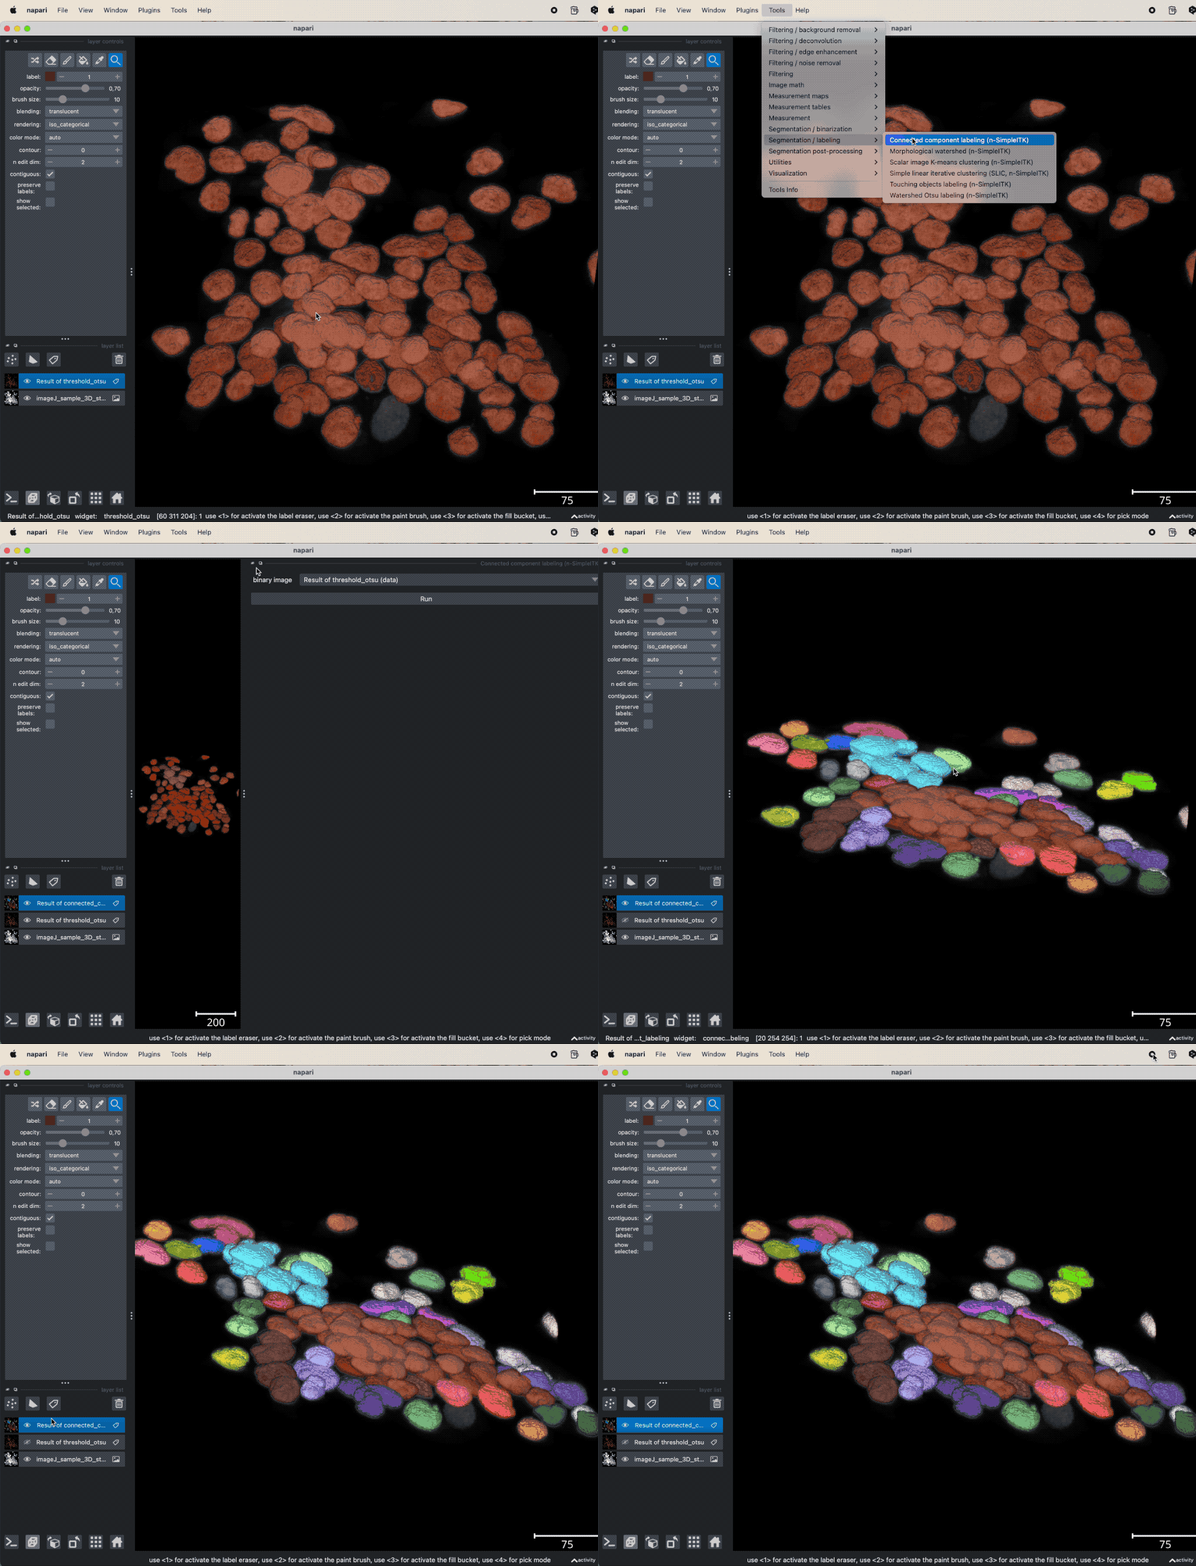 Example of global thresholding of a 3D image. Here, we have applied Otsu’s method and a connected component analysis on the 3D image “imageJ_sample_3D_stack” from the GitHub data folder (the file is originally from the ImageJ sample image setꜛ). Please note the not perfectly separated cell clusters.
This time, the segmentation did not perfectly separate all the cells. There are clusters of cells, that have all the same label and, thus, are interpreted as one object. This is due to the fact, that the cells are densely packed and touch each other. We could further improve the segmentation, e.g., by applying some of the image enhancement methods as described in the previous chapters. Or we manually divide falsely connected cells by using the label eraser tool. However, in some cases the image enhancement will not be sufficient to improve the segmentation using global thresholding methods. And manual post-processing is not feasible for large datasets. In such cases, one may consider alternative solutions such semantic segmentation techniques, which will be described in the next chapters.
Exercise
Perform a image segmentation on the “Cells (3D+2Ch)” sample image. Apply image enhancement measures if appropriate to enhance the cell separation. Extract the properties of the segmented cells and save them as a CSV file.
Further readings
- Napari hub page of the napari-simpleitk-image-processing pluginꜛ
- Wikipedia article on Image thresholdingꜛ
- SimpleITK documentation on Image thresholdingꜛ .
Acknowledgements
The image data used in this tutorial is taken from
- the py-clesperanto sample datasetꜛ for the “blobs_clesperanto” image file, and
- the ImageJ sample image setꜛ for the “imageJ_sample_3D_stack” image file.