Advanced cell segmentation with Cellpose
If you haven’t installed Napari yet, please do so before proceeding with this tutorial. To practice this tutorial, install the following package(s) in your activated Napari conda environment:
conda install -y napari-assistant napari-simpleitk-image-processing cellpose-napari
Update: macOS installation in 2026
After working extensively with both Napari and the Napari Cellpose plugin over the past several years, I have encountered recurring incompatibilities related to the underlying Python package versions required by both tools. As of our 2025 2026 course, the following package versions have proven to work reliably together. I therefore recommend creating a fresh conda environment as follows (this configuration was used in our 2026 course on macOS):
conda create -n napari_cp_2026 -y python=3.8.20
conda activate napari_cp_2026
conda install -y cellpose=3.0.11 cellpose-napari=0.2.0 napari-simpleitk-image-processing=0.4.9
pip install napari[all]
napari
Update: Windows installation in 2026
As of our July 2026 course we were not able to get the Cellpose plugin to work reliably on Windows. Meanwhile, the Cellpose core package has been updated to version 4, which is currently incompatibleꜛ with the Napari Cellpose plugin. Trying to install Cellpose 3 caused version conflicts with PyTorch, regardless which Python version was used. Trying to use the Napari plugin along with Cellpose 4 caused either a crash of Napari or internal module call errors. We can therefore not reliably recommend to use the Napari Cellpose plugin on Windows at this time. We will update this tutorial once a working solution is available.
What is Cellpose?
Cellposeꜛ is a deep learning-based image segmentation tool developed by Carsen Stringer et al (2020)ꜛ that can be used to segment cells in 2D and 3D images. Unlike global thresholding methods, Cellpose performs a pixel-wise semantic segmentation and comes with pre-trained models specifically for the segmentation of cells and nuclei. It is versatile and can be used for a broad variety of microscopy image types, e.g., brightfield or fluorescence images. Cellpose can be utilized in Napari via the cellpose-napariꜛ plugin.
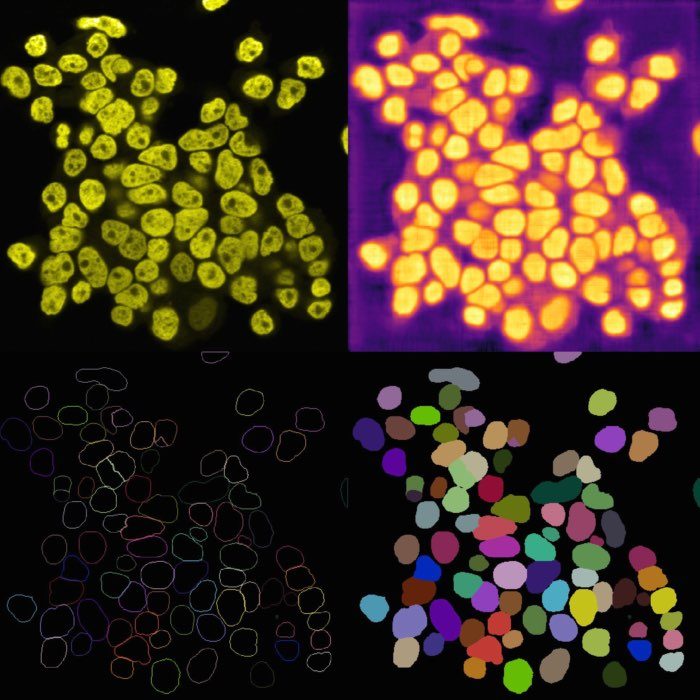
 Cellpose output results. From left to right, top to down: Original image, cell probability mask, distance map, cell outlines, and label image.
Applying Cellpose
You can open the Cellpose widget from the Plugins menu. The widget offers several settings, that can be adjusted. Explaining all these options goes beyond the scope of this tutorial. However, you can find a detailed description of all settings in the Cellpose documentationꜛ. For now, we will use the default settings and only change the Model type to Nuclei. Since our underlying test image (“imageJ_sample_3D_stack”) is 3D, check the process stack as 3D (this is important, otherwise, the plugin will not work properly). Before clicking on run segmentation to start the segmentation, estimate the average diameter of the targeted objects. You can let Cellpose do this for you by clicking on compute diameter from images, or you create a new shape layer and re-draw some exemplary cells, select this layer in the shape layer option and click on compute diameter from shape layer.
 Applying Cellpose on a 3D image (here: “imageJ_sample_3D_stack” from GitHub data folder, see image credits in the acknowledgements section below). Depending on the complexity of the image, the segmentation will take a while. The segmentation results (not shown here) will be displayed in a new layer.
Depending on the complexity of the image, the segmentation will take a while. The segmentation result will be displayed in a new layer and is a label image, where each cell is assigned a unique label (i.e., we do not need to perform a re-labeling function such as a connected component analysis). The label image can again be used to extract properties for each segmented cell, e.g., the area, the mean intensity, location, brightness, and so on. To do so, we can again use the Measure plugin from the “Tools->Measurement tables” menu (see “Feature extraction” in Chapter “Image segmentation and feature extraction”). The plugin will create a table, where each row represents a segmented cell and each column represents a property. The table can be saved as a CSV file or copied to the clipboard for further analysis.
 Assessing the results of the Cellpose segmentation.
 Extracted properties for each segmented cell.
Comparing Cellpose to global thresholding methods
From the direct comparison of the segmentation result from Cellpose to the results of the global thresholding method from the previous chapter using Otsu’s method shows, that the former achieves the far more accurate result. Cellpose is indeed able, to segment each individual cell while the Otsu thresholding was not able to separate all cells well. This is not surprising, as we have used Cellpose with a pre-trained model that is specifically trained for the segmentation of cells/nuclei.
 Comparing the segmentation results using Cellpose (right) the Otsu thresholding method (left).
Further readings
- GitHub repository of Cellposeꜛ
- Cellpose documentationꜛ
- Cellpose websiteꜛ
- Cellpose’s Napari hub pageꜛ
- Stringer, C., Wang, T., Michaelos, M. et al. Cellpose: a generalist algorithm for cellular segmentation. Nat Methods 18, 100–106 (2021). doi.org/10.1038/s41592-020-01018-xꜛ
- Pachitariu, M., Stringer, C. Cellpose 2.0: how to train your own model. Nat Methods 19, 1634–1641 (2022). doi.org/10.1038/s41592-022-01663-4ꜛ
Acknowledgements
The sample image “imageJ_sample_3D_stack” is taken from the ImageJ sample image set, which can be found hereꜛ.