How to read patch clamp recordings in WaveMetrics IGOR binary files (ibw) in Python
In patch clamp electrophysiology, the behavior of ion channels is studied by measuring ionic currents in isolated cells or patches of the cell membrane. These recordings are most commonly done with IGORꜛ by WaveMetrics, which brings its own binary file format (.ibw). All it takes to read these files in Python are the packages
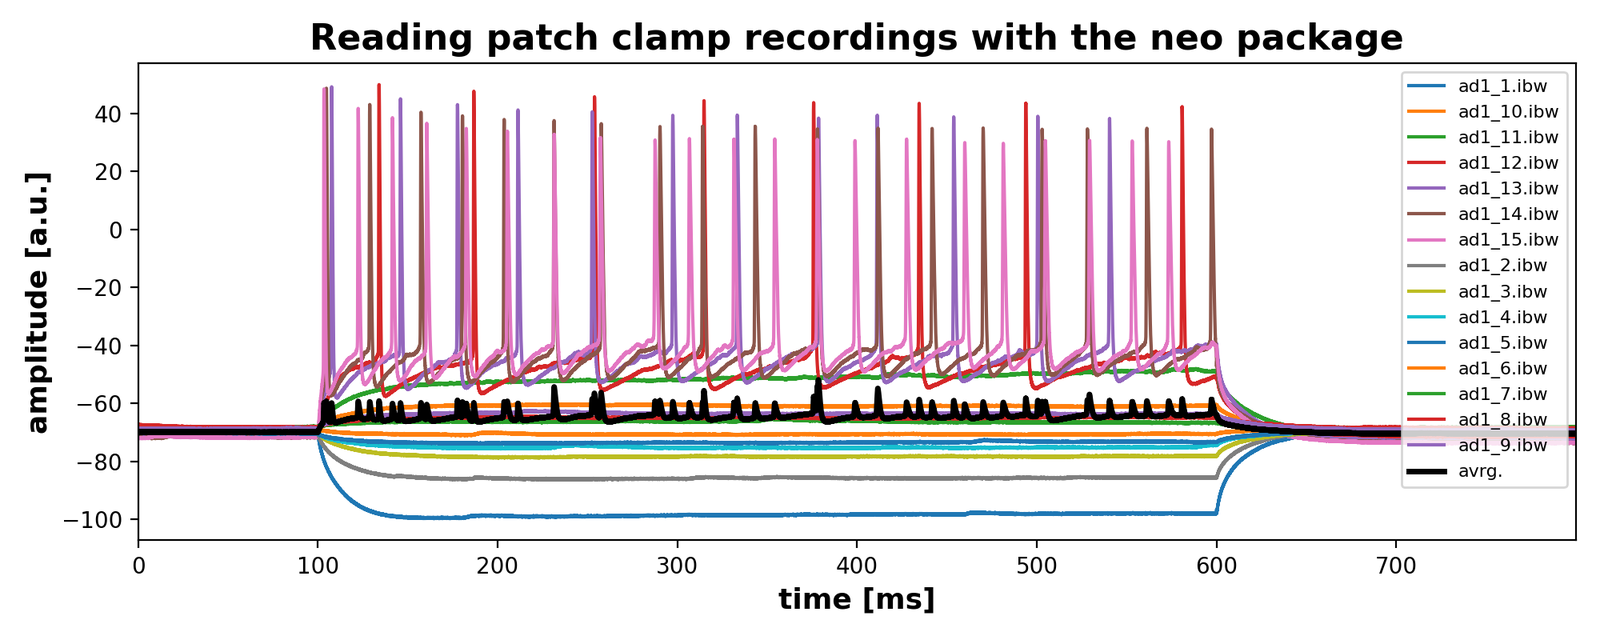
The neo package is a whole suite for electrophysiology data. In this example we make use of only two functions in order to extract and plot the patch clamp recordings of an example data set:
io.IgorIOread_analogsignal()
import numpy as np
import matplotlib.pyplot as plt
import os
from neo import io
from scipy.signal import find_peaks

# define paths:
file_path = "Data/"
file_names = [file for file in os.listdir(file_path) if file.endswith('.ibw')]
file_names = sorted(file_names)

# read the first file in order to extract the shape of the recorded time-series:
dummy_read_file = os.path.join(file_path, file_names[0])
dummy_read      = io.IgorIO(dummy_read_file).read_analogsignal()

# allocate a dummy variable for calculating the grand average:
all_igor_reads  = np.empty((dummy_read.shape[0], 0))

# plot and collect all igor files data:
fig = plt.figure(1, figsize=(10,4))
plt.clf()
for file in file_names:

    current_file      = os.path.join(file_path, file)
    current_igor_read = io.IgorIO(current_file).read_analogsignal()

    all_igor_reads    = np.append(all_igor_reads, current_igor_read.as_array(), axis=1)

    """ You can calculate the time-array manually,

        current_sampling_rate=np.array(current_igor_read.sampling_rate)
        current_time_array = np.arrange(current_igor_read.shape[0]) current_sampling_rate
        plt.plot(current_time_array, current_igor_read, label=file)

    or use the .times attribute of the read igor file.
    """
    plt.plot(current_igor_read.times, current_igor_read, label=file)

plt.plot(current_igor_read.times, all_igor_reads.mean(axis=1), lw=2.5, c="k", label="avrg.")
plt.xlabel("time [ms]", fontsize=13)
plt.ylabel("amplitude [a.u.]", fontsize=13)
plt.title("Reading patch clamp recordings with the neo package", fontsize=16, fontweight="bold")
plt.legend(loc="upper right",fontsize=8)
plt.xlim(0, current_igor_read.times[-1:])
plt.tight_layout()
plt.savefig(file_path + "overview.pdf")
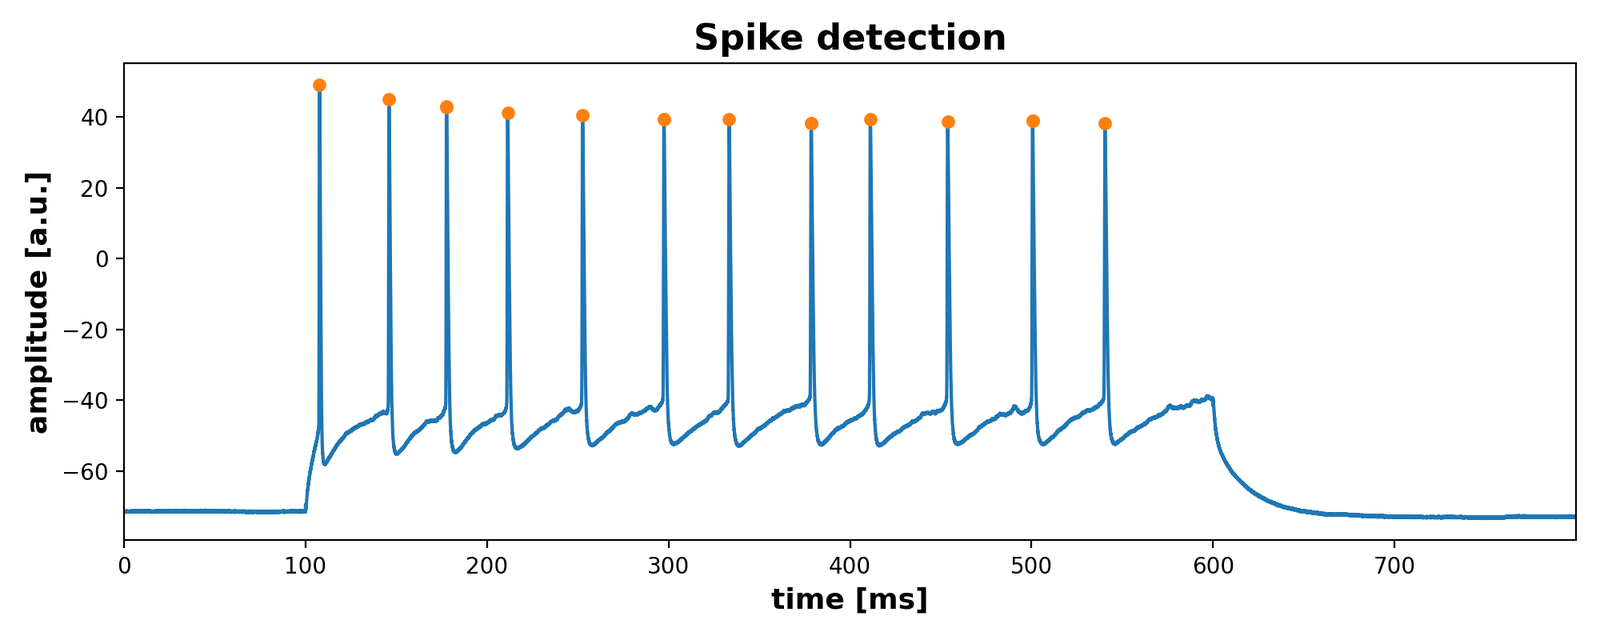
With scipy’s findpeak function you could then for example detect and extract the peaks in each recording. Here is an example for one recording (‘ad1_13.ibw’):
from scipy.signal import find_peaks

# define the spike-threshold:
spike_threshold = -10

# read one example recording:
dummy_read_file = os.path.join(file_path, file_names[4])
dummy_read      = io.IgorIO(dummy_read_file).read_analogsignal()

# apply the findpeaks function:
current_spike_mask, _ = find_peaks(dummy_read.as_array().flatten(), height=spike_threshold)

# plot:
fig = plt.figure(3, figsize=(10, 4))
plt.clf()
plt.plot(current_igor_read.times, dummy_read)
plt.plot(current_igor_read.times[current_spike_mask],
         dummy_read.as_array().flatten()[current_spike_mask], '.', ms=10)
plt.xlabel("time [ms]", fontsize=13)
plt.ylabel("amplitude [a.u.]", fontsize=13)
plt.title("Spike detection", fontsize=16, fontweight="bold")
plt.xlim(0, current_igor_read.times[-1:])
plt.tight_layout()
plt.savefig(file_path + "overview with spike detection.pdf")
You can find the Python script of this mini tutorial along with the example in this GitHub repositoryꜛ.

comments