On the role of gap junctions in neural modelling: Network example
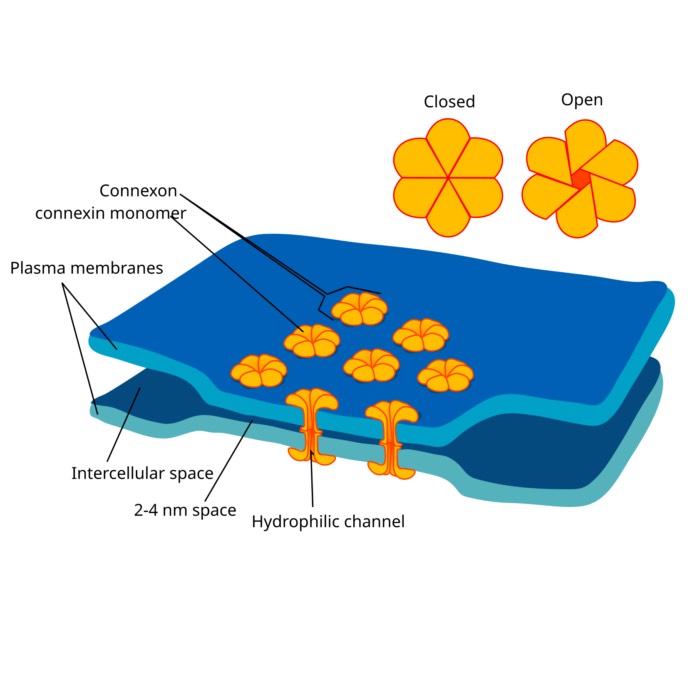
As a follow-up to our previous post on gap junctions, we will now explore how gap junctions can be implemented in a network of spiking neurons (SNN) using the NEST simulator. Gap junctions are electrical synapses that allow direct electrical communication between neurons, which can significantly influence the dynamics of neural networks. For more biological background, please refer to the previous post.
Simulation code
We will use the NEST simulator to simulate a simple network of 500 inhibitory neurons connected by gap junctions. This example replicates and slightly modifies the NEST tutorial “Gap Junctions: Inhibitory network example”ꜛ.
Let’s begin with importing the necessary libraries:
import matplotlib.pyplot as plt
import matplotlib.gridspec as gridspec
import numpy as np
import nest

# set global properties for all plots:
plt.rcParams.update({'font.size': 12})
plt.rcParams["axes.spines.top"]    = False
plt.rcParams["axes.spines.bottom"] = False
plt.rcParams["axes.spines.left"]   = False
plt.rcParams["axes.spines.right"]  = False

# for reproducibility:
np.random.seed(1)
nest.ResetKernel()
nest.set_verbosity("M_WARNING")
Next, we set the parameters of the network. We will create a network of 500 inhibitory neurons with 60 gap junctions per neuron and 50 inhibitory synapses per neuron. The synaptic delay is set to 1.0 ms, and the synaptic weights are 300 pA for excitatory synapses and -50 pA for inhibitory synapses. The total simulation time is set to 501 ms. The gap junction weightꜛ is set to an initial value of 0.00. This parameter controls the strength of the electrical coupling between neurons.
# set the parameters of the network:
n_neuron        = 500   # number of neurons
gap_per_neuron  = 60    # number of gap junctions per neuron
inh_per_neuron  = 50    # number of inhibitory synapses per neuron
delay           = 1.0   # synaptic delay [ms]
j_exc           = 300.0 # excitatory synaptic weight [pA]
j_inh           = -50.0 # inhibitory synaptic weight [pA]
gap_weight      = 0.00  # gap junction weight [nS]

# set the resolution and the number of threads of the simulation:
simtime         = 501.0 # simulation time [ms]
threads         = 8     # number of threads for the simulation
stepsize        = 0.05  # step size of the simulation [ms] (default: 0.1)
nest.resolution = stepsize
nest.total_num_virtual_procs = threads
nest.print_time = True
We set the waveform relaxation parametersꜛ for the simulation. Waveform relaxation (WFR) is a technique to solve the differential equations of the neuron models in parallel. Without use_wfr=True, communication would occur at every step rather than using the iterative WFR scheme:
nest.use_wfr = True
nest.wfr_comm_interval = 1.0
nest.wfr_tol = 0.0001
nest.wfr_max_iterations = 15
nest.wfr_interpolation_order = 3
Next, we create the neurons, the spike recorder, and the Poisson generator for the excitatory input. We connect the neurons with inhibitory synapses and excitatory Poisson input. We set the initial membrane potential of the neurons as a random value between -80 and -40 mV. For the connections between the neurons, we use the fixed_indegree rule with an indegree of 50 and no autapses. We connect the neurons to the spike recorder to record the spikes using the default all_to_all rule:
neurons = nest.Create("hh_psc_alpha_gap", n_neuron)
spikerecorder = nest.Create("spike_recorder")
pg = nest.Create("poisson_generator", params={"rate": 500.0})

conn_dict = {"rule": "fixed_indegree",
             "indegree": inh_per_neuron,
             "allow_autapses": False,
             "allow_multapses": True}

syn_dict = {"synapse_model": "static_synapse",
            "weight": j_inh,
            "delay": delay}

nest.Connect(neurons, neurons, conn_dict, syn_dict)

nest.Connect(pg, neurons, "all_to_all",
             syn_spec={"synapse_model": "static_synapse",
                       "weight": j_exc,
                       "delay": delay})

nest.Connect(neurons, spikerecorder)
neurons.V_m = nest.random.uniform(min=-80.0, max=-40.0)
Now, we create the gap junctions between the neurons. We randomly select a subset of neurons and connect them with gap junctions using the one_to_one rule:
# create gap junctions between the neurons:
n_connection = int(n_neuron * gap_per_neuron / 2)
neuron_list  = neurons.tolist()
connections  = np.random.choice(neuron_list, [n_connection, 2])
for source_node_id, target_node_id in connections:
    nest.Connect(
        nest.NodeCollection([source_node_id]),
        nest.NodeCollection([target_node_id]),
        {"rule": "one_to_one",
         "make_symmetric": True},
        {"synapse_model": "gap_junction",
         "weight": gap_weight})
Finally, we simulate the network. Depending on your machine, the simulation may take a while:
# simulate the network:
nest.Simulate(simtime)
After the simulation, we extract the number of events and the firing rate of the network for visualization:
# extract the number of events and the firing rate:
n_spikes = spikerecorder.n_events
hz_rate = (1000.0 * n_spikes / simtime) / n_neuron

# extract the spike times and neuron IDs from the excitatory spike recorder:
spike_events = nest.GetStatus(spikerecorder, "events")[0]
spike_times = spike_events["times"]
neuron_ids = spike_events["senders"]

# combine the spike times and neuron IDs into a single array and sort by time:
spike_data = np.vstack((spike_times, neuron_ids)).T
spike_data_sorted = spike_data[spike_data[:, 0].argsort()]

# extract sorted spike times and neuron IDs:
sorted_spike_times = spike_data_sorted[:, 0]
sorted_neuron_ids = spike_data_sorted[:, 1]

# spike raster plot and histogram of spiking rate:
fig = plt.figure(figsize=(6, 6))
gs = gridspec.GridSpec(5, 1)

# create the first subplot (3/4 of the figure)
ax1 = plt.subplot(gs[0:4, :])
ax1.scatter(sorted_spike_times, sorted_neuron_ids, s=9.0, color='mediumaquamarine', alpha=1.0)
plt.title(f"Network of {n_neuron} inhibitory neurons with gap junctions\ngap_weight: {gap_weight}, average spike rate: {hz_rate:.2f} Hz")
#ax1.set_xlabel("time [ms]")
ax1.set_xticks([])
ax1.set_ylabel("neuron ID")
ax1.set_xlim([0, simtime+5])
ax1.set_ylim([0, n_neuron+1])
ax1.set_yticks(np.arange(0, n_neuron+1, 100))

# create the second subplot (1/4 of the figure)
ax2 = plt.subplot(gs[4, :])
hist_binwidth = 5.0
t_bins = np.arange(np.amin(sorted_spike_times), np.amax(sorted_spike_times), hist_binwidth)
n, bins = np.histogram(sorted_spike_times, bins=t_bins)
heights = 1000 * n / (hist_binwidth * (n_neuron))
ax2.bar(t_bins[:-1], heights, width=hist_binwidth, color='violet')
#ax2.set_title(f"histogram of spiking rate vs. time")
ax2.set_ylabel("firing rate\n[Hz]")
ax2.set_xlabel("time [ms]")
ax2.set_xlim([0, simtime+5])
#ax2.set_ylim([0, 200])

plt.tight_layout()
plt.show()
Simulaton results
The following plots show the simulation results for different gap junction weights:
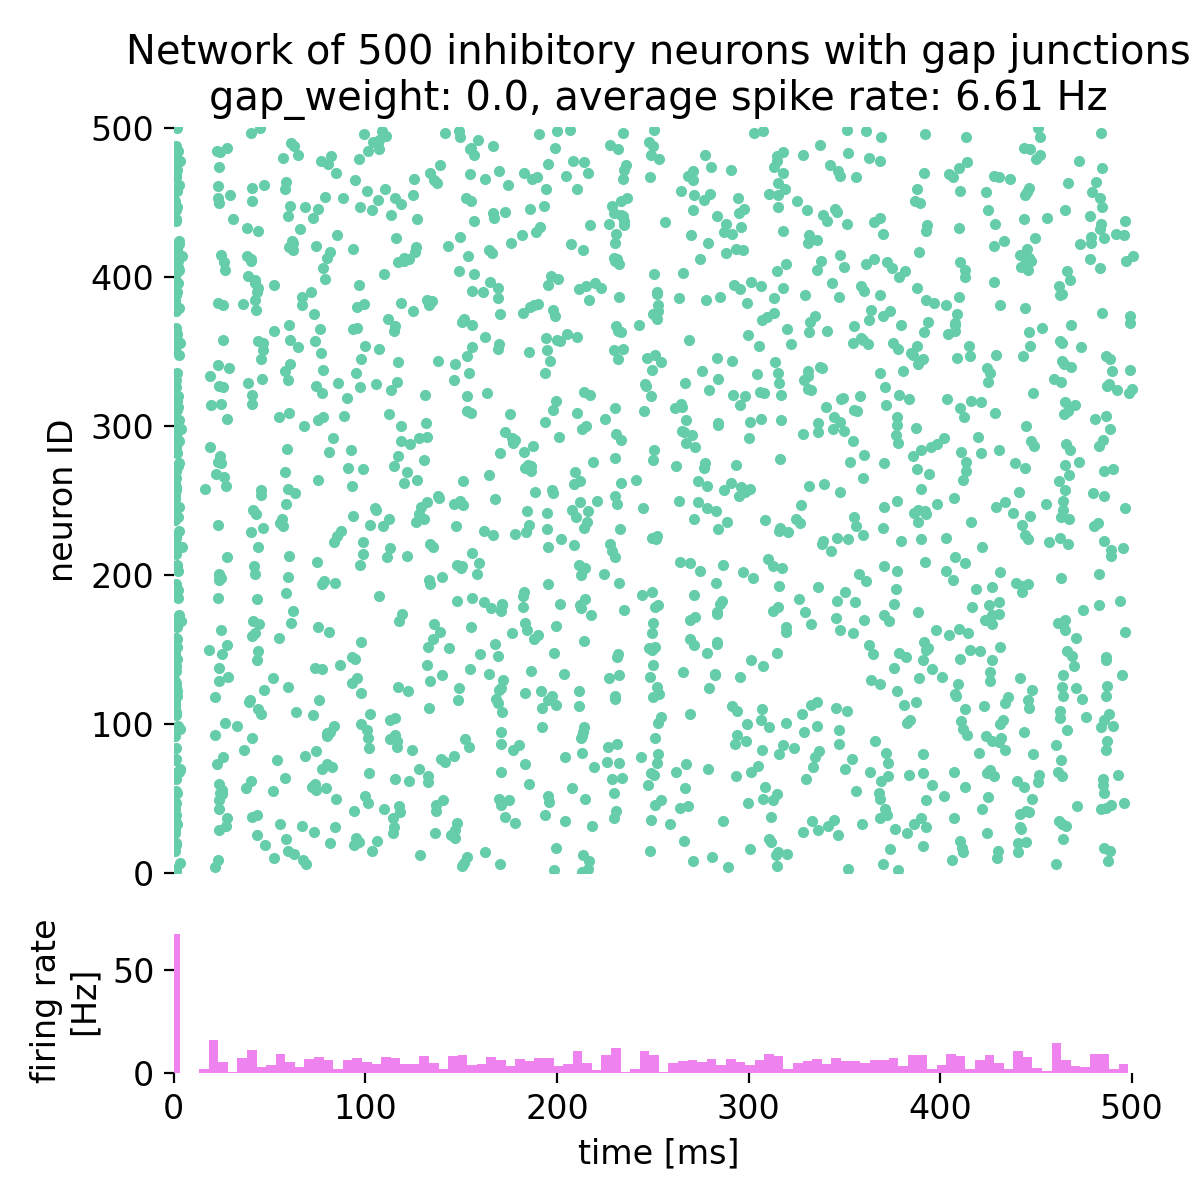
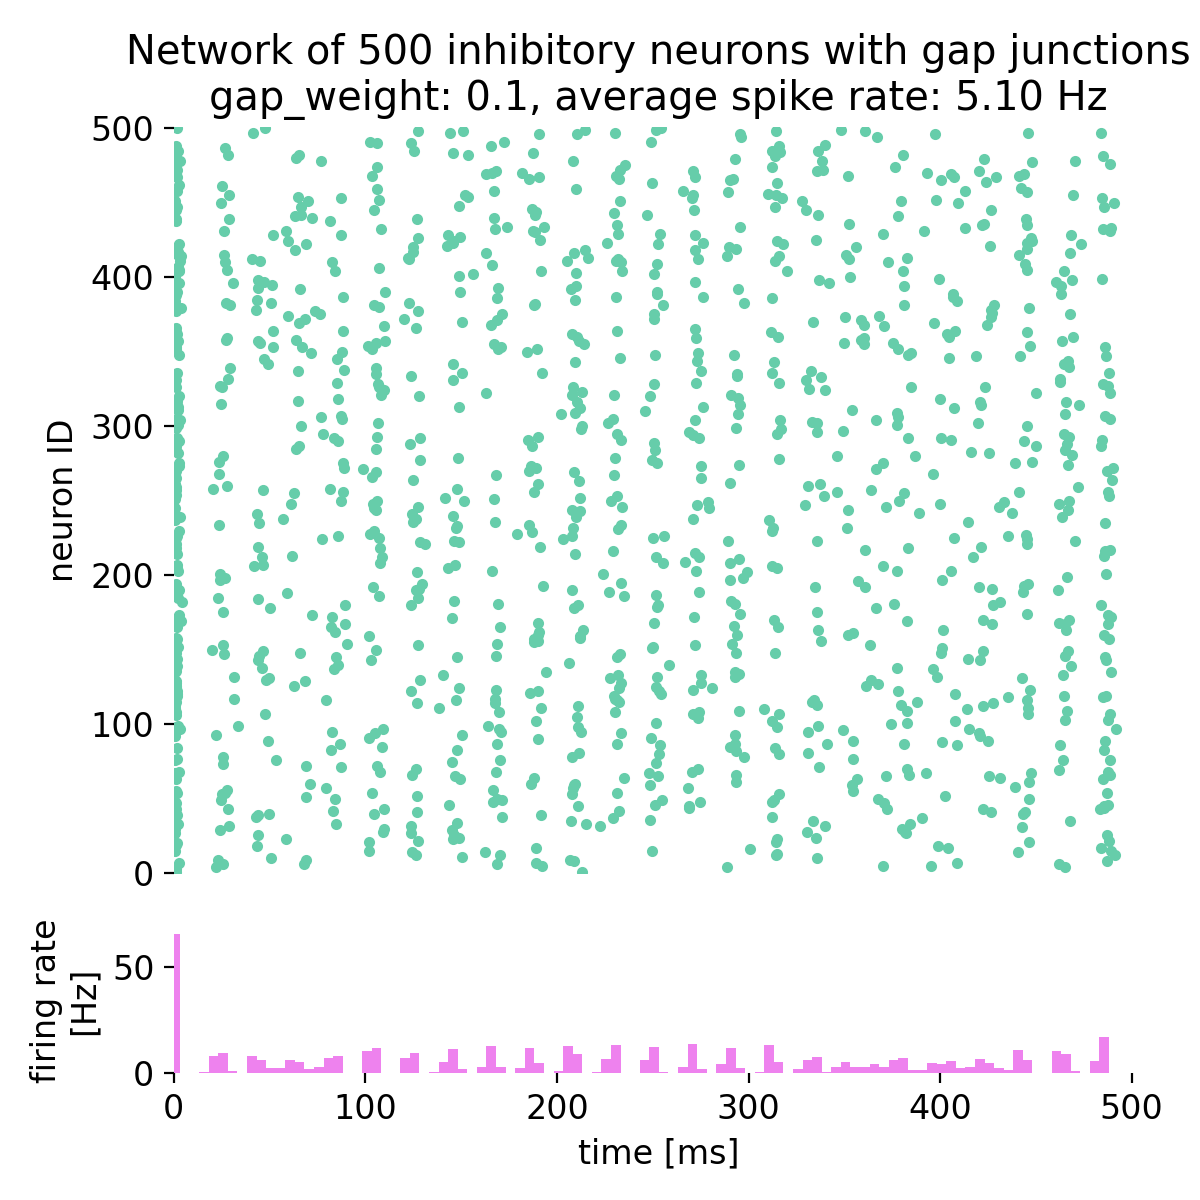
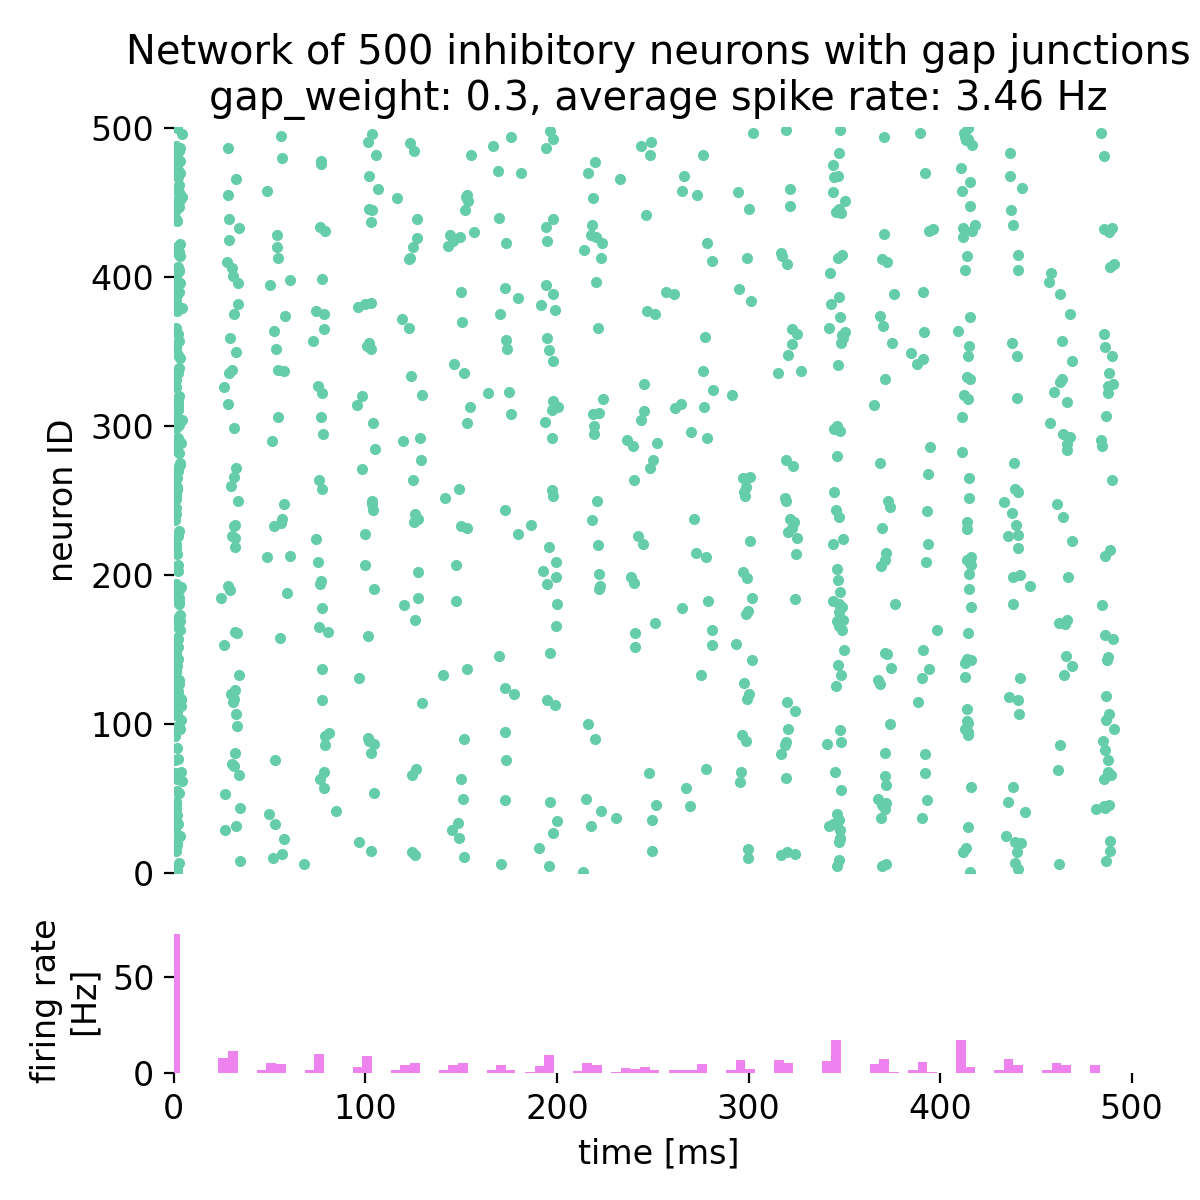
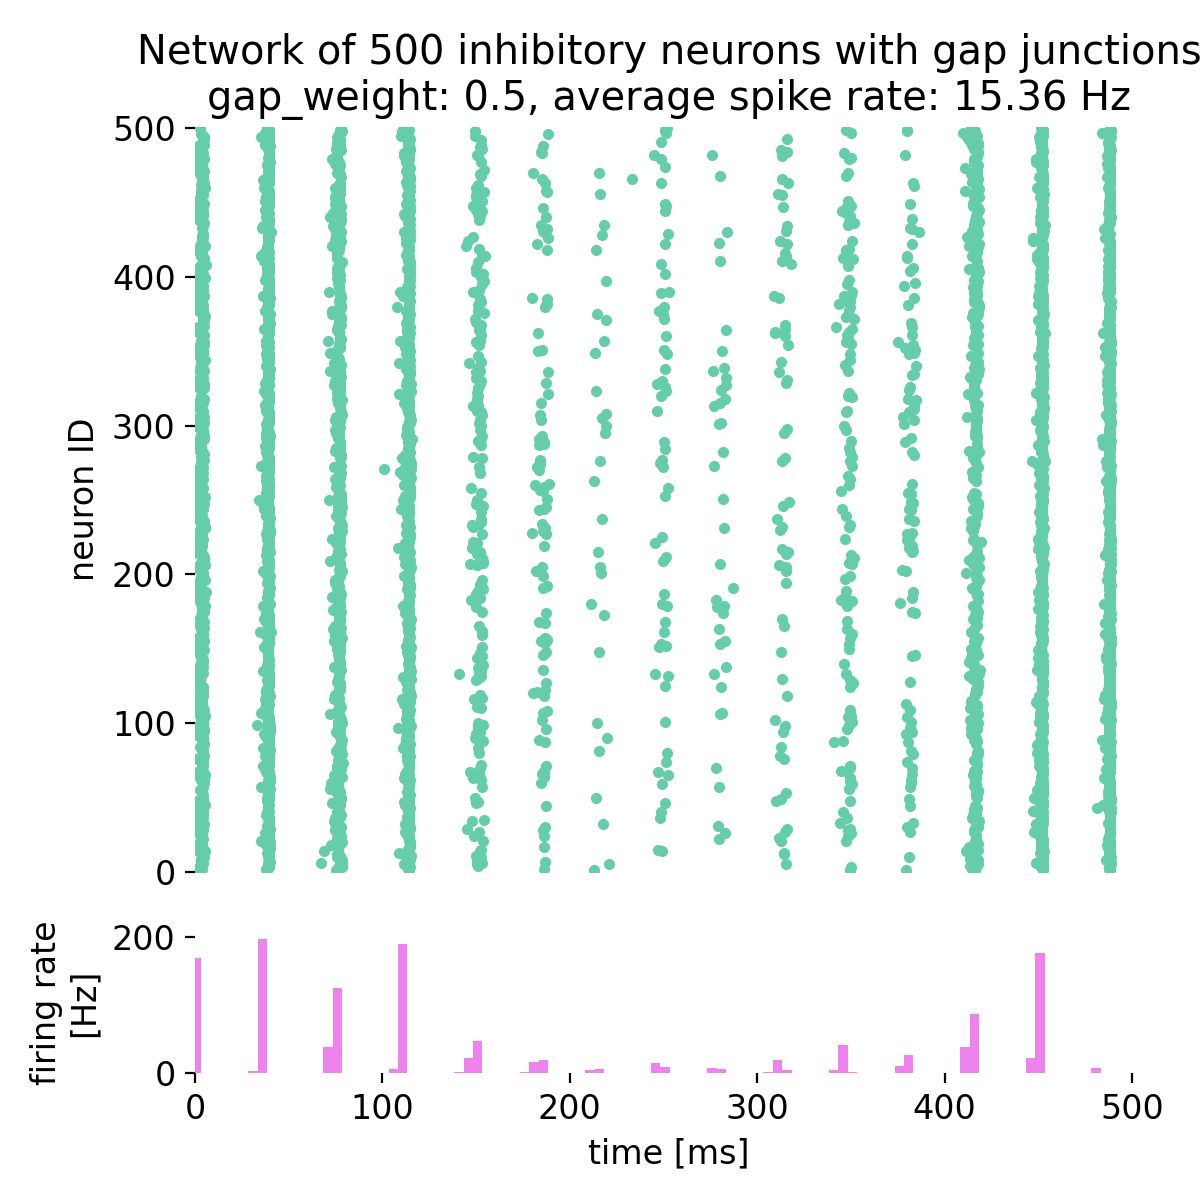
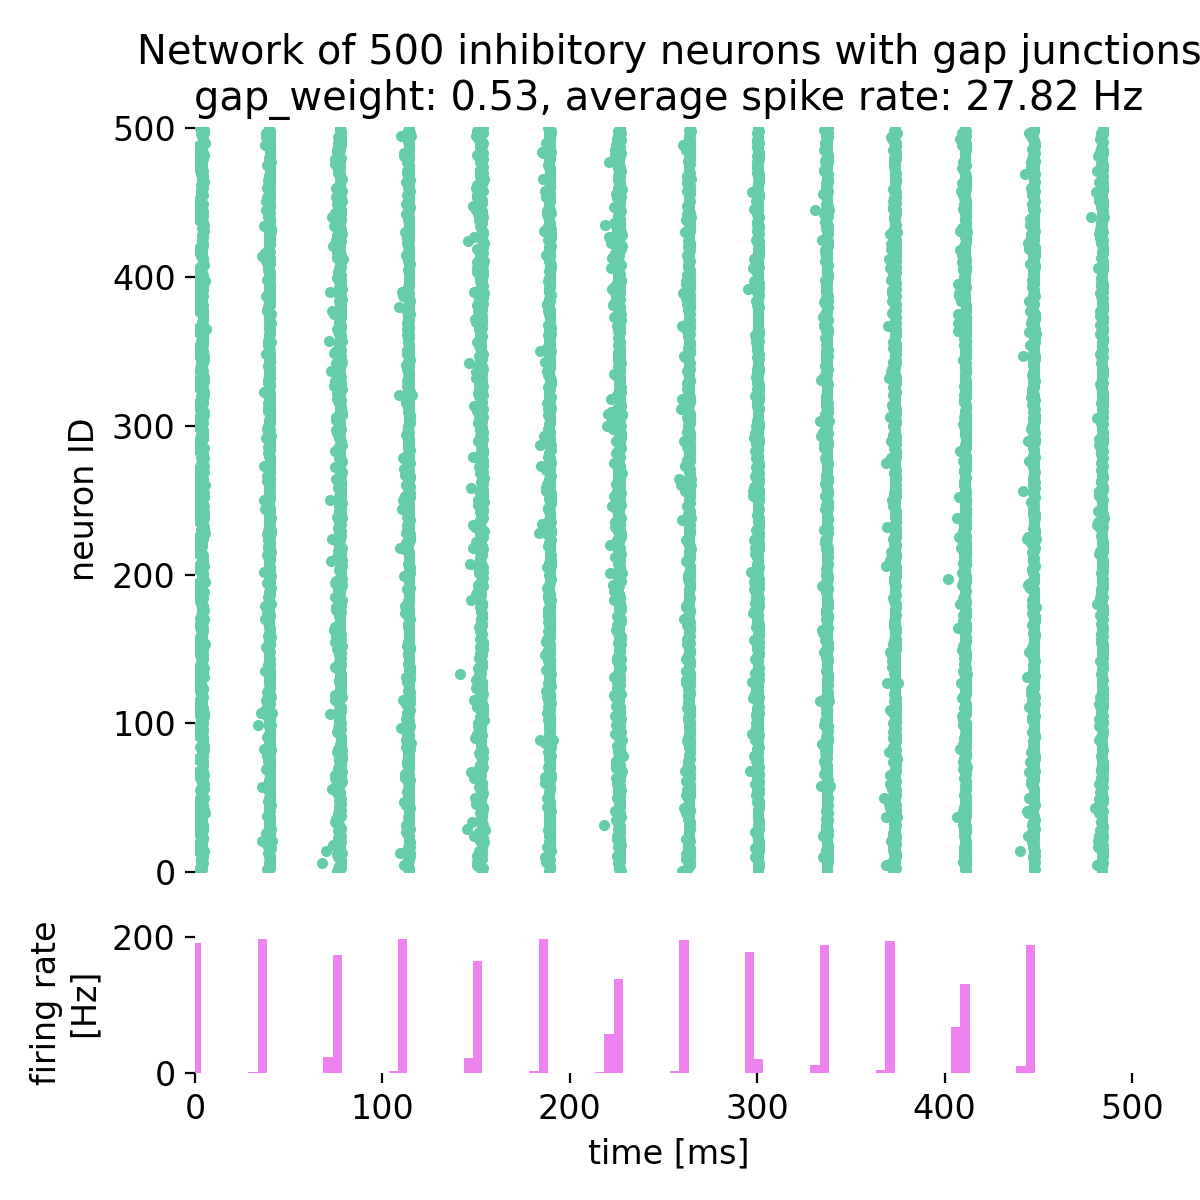
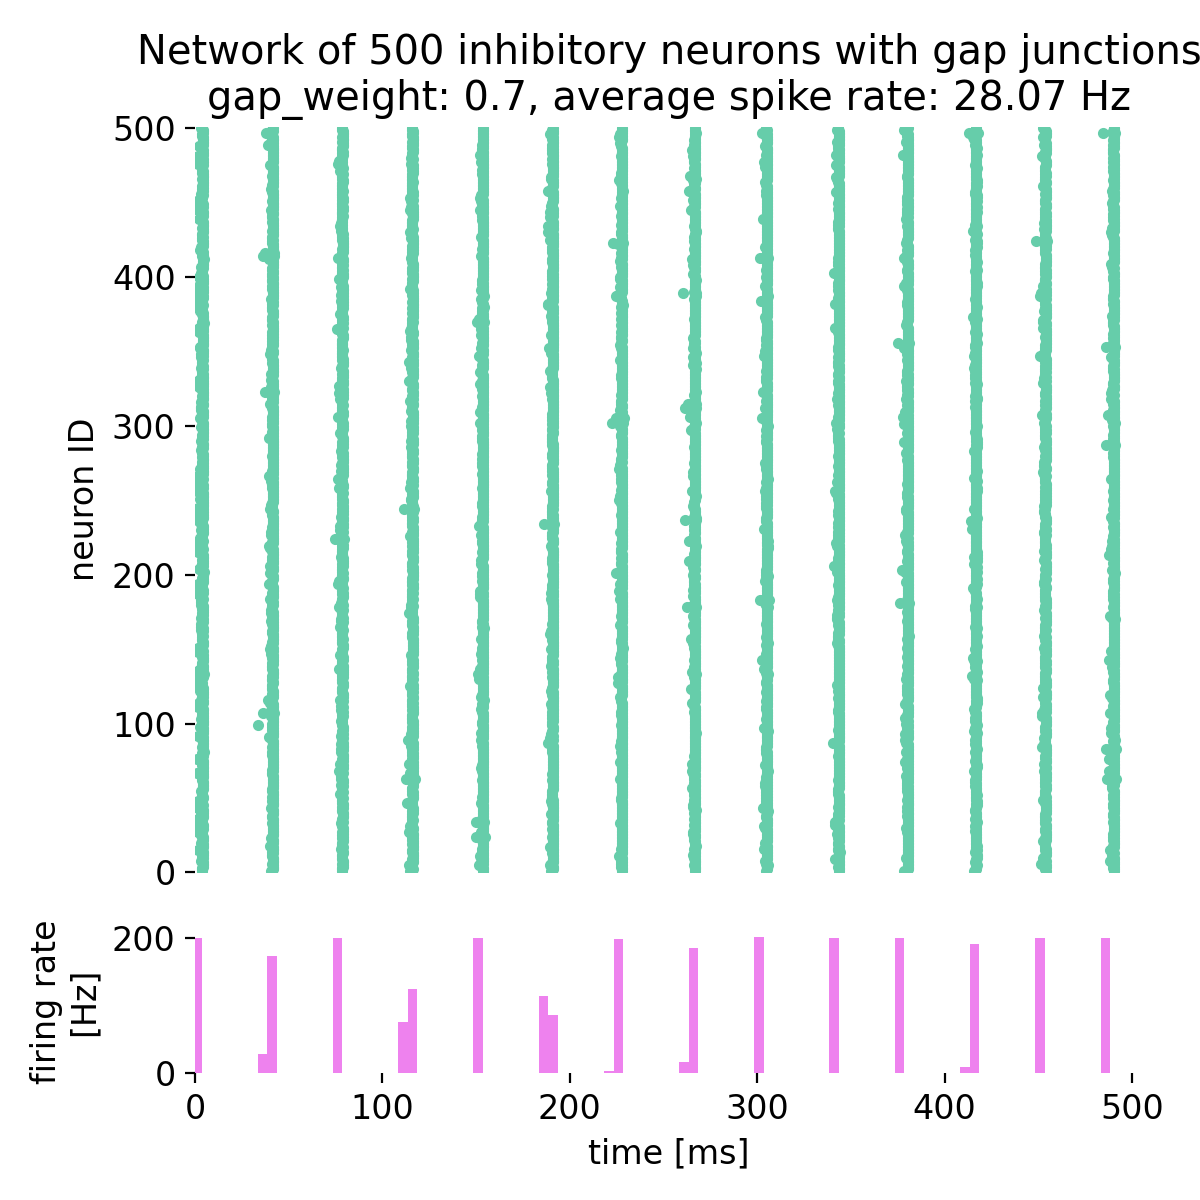
Spike raster plot and histogram of the spiking rate of a network of 500 inhibitory neurons with gap junctions. The simulation was run for different gap junction weights: 0.0, 0.1, 0.3, 0.5, 0.53, and 0.7. The average spike rate of the network is shown in the title of each plot.
By setting the gap junction weight to 0.0, i.e., no gap junctions are established, we observe that the network is not synchronized and is in an irregular state. This is due to external excitatory Poisson drive being balanced by the inhibitory feedback within the network. As we increase the gap junction weight, the network becomes more synchronized and global oscillations emerge. For a gap junction weight of 0.53 and higher, the network is in a state of synchronized oscillations. The average firing rate is not linearly dependent on the gap junction weight and varies depending on the network dynamics.
This behavior is consistent with prior work showing that electrical coupling among inhibitory interneurons promotes synchrony and fast rhythms (Mancilla et al., 2007ꜛ; Bennett & Zukin, 2004ꜛ; Connors & Long, 2004ꜛ). In other words, increasing gap conductance reduces phase dispersion and favors coherent population activity.
Quantifying synchrony and oscillations
Beyond visual inspection, we can quantify the degree of synchrony and rhythmicity in the network using two summary metrics derived from the binned population activity:
Population-rate variability index (PRVI)
We define the population rate as the number of spikes across all neurons within a fixed-size time bin. Let the bin width be $\Delta t$ (e.g., 2 ms), and let $r_n$ denote the population rate (in Hz) in the $n$-th bin:
\[r_n = \frac{1000}{\Delta t} \cdot \frac{1}{N} \cdot \text{spike count in bin } n\]where $N$ is the number of neurons and the factor $1000/\Delta t$ converts spikes per bin into Hz.
From the resulting rate sequence ${r_n}$, we compute a population-rate variability index, or short PRVI, as the coefficient of variation:
\[\text{PRVI} = \frac{\sigma_{\text{rate}}}{\mu_{\text{rate}} + \varepsilon}\]where:
- $\mu_{\text{rate}} = \text{mean}(r_n)$
- $\sigma_{\text{rate}} = \text{std}(r_n)$
- $\varepsilon = 10^{-12}$ is a small constant to avoid division by zero
PRVI captures the relative fluctuation of the population rate. A low PRVI indicates asynchronous, irregular activity (rate is approximately constant); a high PRVI indicates large rate swings, typical of synchronous bursting.
Peak frequency (dominant oscillation)
To extract rhythmicity, we compute the power spectrum of the mean-subtracted rate signal $\tilde{r}_n = r_n - \mu_{\text{rate}}$. The discrete Fourier transform gives complex coefficients $R_k$, from which the power at frequency $f_k$ is:
\[P(f_k) = |R_k|^2\]The frequency grid is determined by:
\[f_k = \frac{k}{M \cdot \Delta t / 1000} \quad \text{(Hz)}\]where $M$ is the number of bins.
The peak frequency, or dominant oscillation, is defined as:
\[f_{\text{peak}} = \underset{k \geq 1}{\text{argmax}}\, P(f_k)\]excluding the DC component $k = 0$, which reflects only the mean rate.
Implementation
Let’s implement these metrics directly into a Python code:
# calculate the population rate and PRVI (population rate variability index):

# bin spikes:
binwidth = 2.0  # ms; (e.g., 2 ms bins)
t_min, t_max = sorted_spike_times.min(), sorted_spike_times.max()
bins = np.arange(t_min, t_max + binwidth, binwidth)
counts, _ = np.histogram(sorted_spike_times, bins=bins)
rate = (1000.0 / binwidth) * counts / n_neuron  # Hz

# PRVI: coefficient of variation of the population rate:
prvi = np.std(rate) / (np.mean(rate) + 1e-12)

# power spectrum and peak frequency:
freqs = np.fft.rfftfreq(len(rate), d=binwidth/1000.0)  # Hz
power = np.abs(np.fft.rfft(rate))**2
peak_freq = freqs[np.argmax(power[1:]) + 1]  # skip the DC component at index 0

print(f"for a gap junction weight of {gap_weight} nS:")
print(f"PRVI (synchrony index): {prvi:.3f}")
print(f"Peak frequency: {peak_freq:.1f} Hz")
Here, I used 2 ms bins for the population rate and PRVI calculation. The PRVI gives us a measure of how synchronous the network activity is, while the peak frequency indicates the dominant oscillation frequency in the population activity.
I have calculated the PRVI and peak frequency for the different gap junction weights used in the simulation:
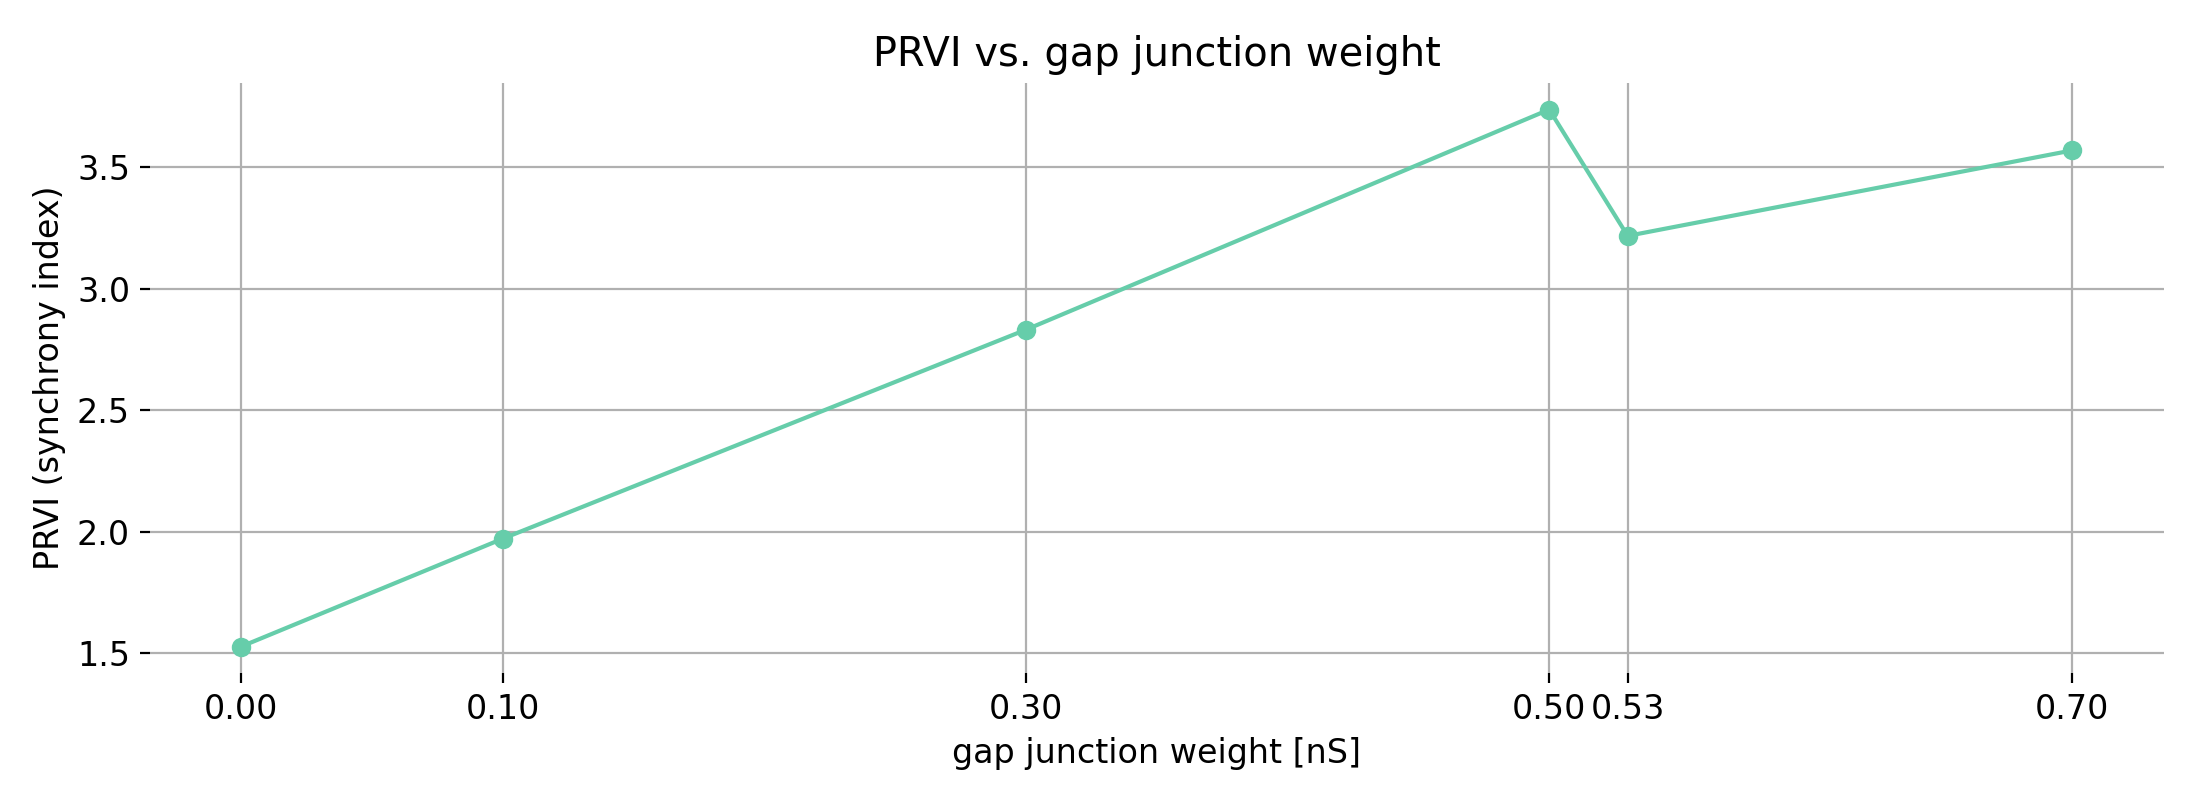
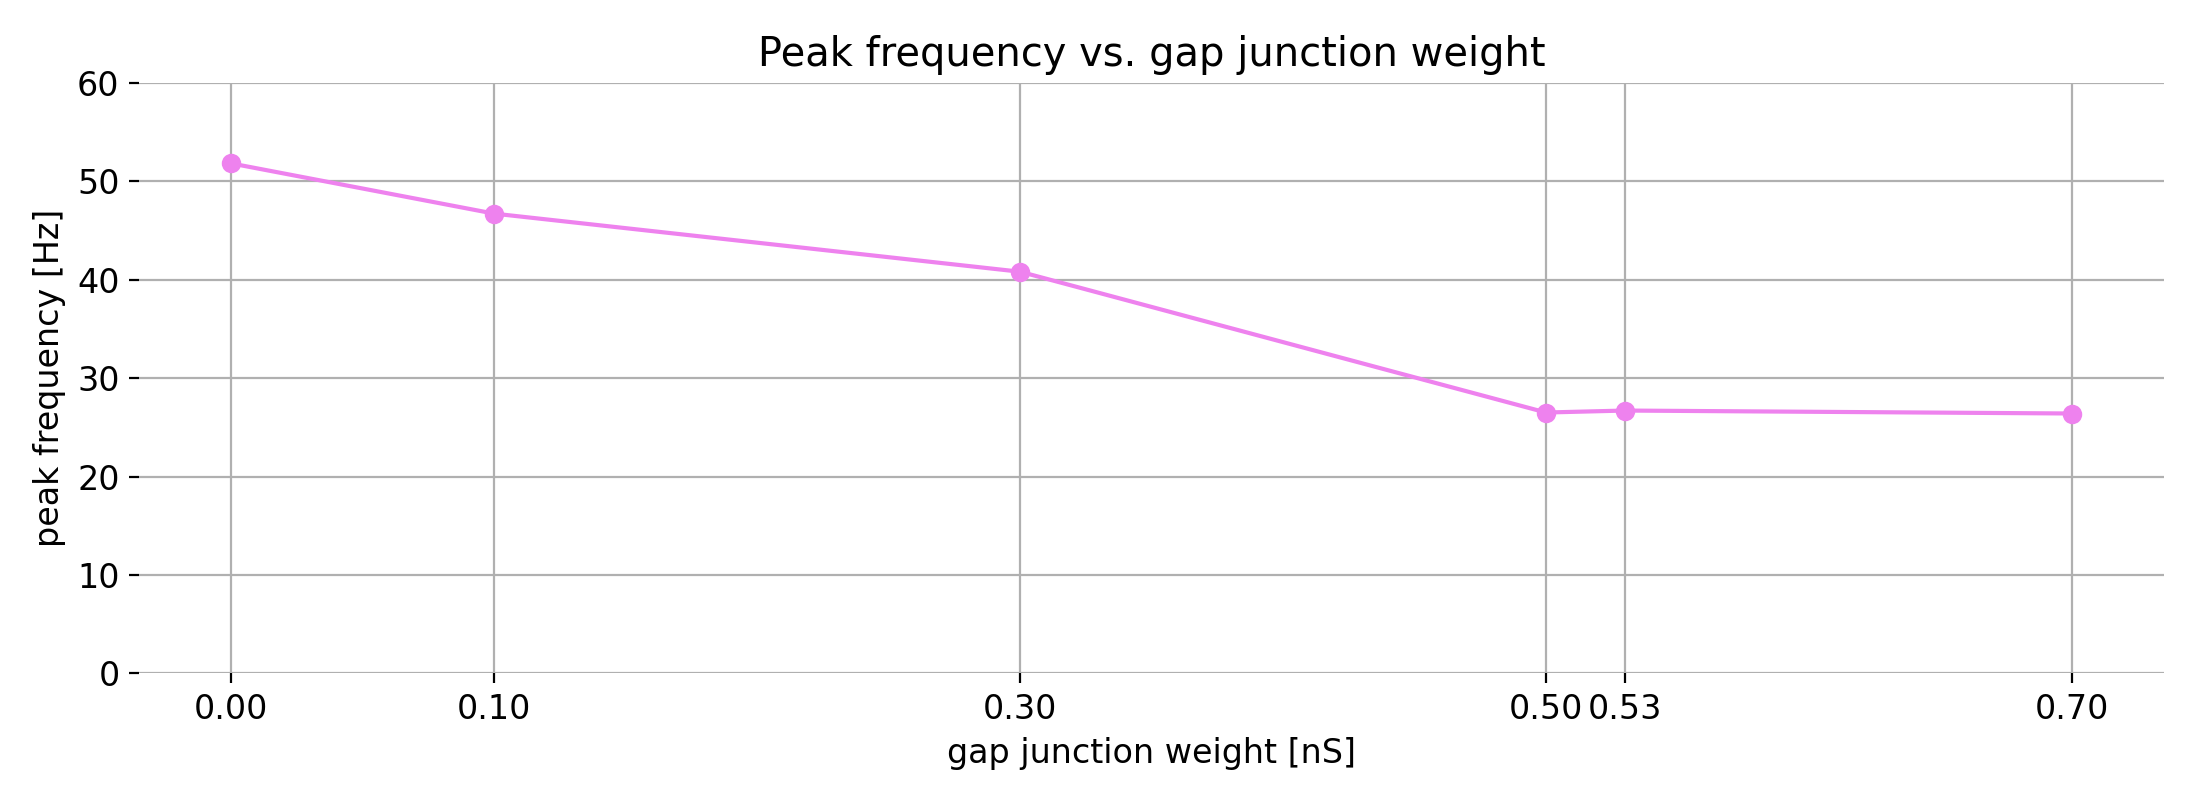 Population-rate variance index (PRVI, top) and peak frequency (bottom) of the network of 500 inhibitory neurons with gap junctions as a function of the gap junction weight (0.00, 0.10, 0.30, 0.50, 0.53, 0.70 nS). The PRVI is a measure of synchrony, while the peak frequency is the dominant oscillation frequency of the network. The PRVI increases with the gap junction weight (i.e., with coupling), indicating stronger synchrony, while the the dominant frequency drops from ~52 Hz (uncoupled) to ~26–27 Hz under strong coupling. Around the transition (~0.5–0.53 nS), the PRVI hump does not exactly coincide with when the raster shows tight, banded synchrony. This is a common observation in network dynamics and requires some explanation (see description below).
Across the six coupling conditions, the PRVI (top panel) rises steeply with gap-junction weight, indicating progressively larger population-rate fluctuations. In parallel, the dominant frequency (bottom panel) drops from ~52 Hz at 0 nS to ~26–27 Hz once coupling is strong, consistent with emergence of slower, coherent population rhythms under electrical coupling. However, we also see that the PRVI does not peak at the same point as the raster shows “full” synchrony emerging. This is a common observation in network dynamics and requires some explanation:
(1) PRVI tracks “big oscillations”, not strict phase-locking.
PRVI is the coefficient of variation of the population rate. As coupling increases, subgroups can fire in loosely aligned bursts that already generate large-amplitude population-rate swings (PRVI goes up) even though spikes are not yet tightly phase-locked across cells, i.e., the spikes are not yet temporally aligned across trials or neurons. A small further increase ($\approx$0.53 nS here) sharpens the phase distribution and produces the observed banded raster. This distinction, rate-variance/coherence vs. spike phase-locking, is well established in population-activity theory and synchrony metrics based on rate variance or spectral power (Hansel & Sompolinsky, 1996ꜛ; Ginzburg & Sompolinsky, 1994ꜛ; Golomb & Rinzel, 1994ꜛ). For electrical coupling specifically, gap junctions are known to boost population-rate coherence and spectral peaks before perfect locking sets in (Pfeuty et al., 2005ꜛ; Pfeuty et al., 2007ꜛ).
(2) Short recordings and binning could make PRVI near the transition noisy.
With ~0.5 s of data and few ms bins, variance and spectral estimates fluctuate. Around the transition, we also observe a frequency shift ($\approx$52 $\rightarrow$ 26 Hz). Because PRVI depends on how cycles align with bin edges and the analysis window, small shifts in frequency or window alignment can create non-monotonic PRVI between 0.50 and 0.53 nS even as the raster clearly tightens.
Thus, we should use PRVI as a quick “how large are the population oscillations?“-index, and complement it with an additional phase-locking readout (e.g., vector strength/Kuramoto order parameter or pairwise spike-time synchrony; Strogatz, 2000ꜛ; Acebrón et al., 2005ꜛ; Goldberg & Brown, 1969ꜛ; Victor & Purpura, 1996ꜛ; Kreuz et al., 2007ꜛ; Schreiber et al., 2003ꜛ).
Conclusion
In this tutorial, we have seen how gap junctions influence the dynamics of a network of spiking neurons. By establishing gap junctions between inhibitory neurons, we observed that the network can transition from an irregular state to synchronized oscillations. The strength of the gap junctions plays a crucial role in determining the network dynamics, with higher gap junction weights leading to more synchronized activity. Thus, gap junctions are an essential component of neural networks and can contribute to the generation of coherent activity patterns.
The complete code used in this blog post is available in this Github repositoryꜛ (gap_junctions_in_inhibitory_network.py). Feel free to modify and expand upon it, and share your insights.
References
- Juan A. Acebrón, L. L. Bonilla, Conrad J. Pérez Vicente, Félix Ritort, & Renato Spigler, The Kuramoto model: A simple paradigm for synchronization phenomena, 2005, American Physical Society (APS), Reviews of Modern Physics, Vol. 77, Issue 1, pages 137-185, doi: 10.1103/revmodphys.77.137ꜛ
- Barry W. Connors , Michael A. Long, Electrical synapses in the mammalian brain, 2004, Annual Review of Neuroscience, Vol. 27, Issue 1, pages 393-418, doi: 10.1146/annurev.neuro.26.041002.131128ꜛ
- J. M. Goldberg, P. B. Brown, Response of binaural neurons of dog superior olivary complex to dichotic tonal stimuli: some physiological mechanisms of sound localization., 1969, Journal of Neurophysiology, Vol. 32, Issue 4, pages 613-636, doi: 10.1152/jn.1969.32.4.613ꜛ
- Jan Hahne, Moritz Helias,, Susanne Kunkel, Jun Igarashi, Matthias Bolten, Andreas Frommer, Markus Diesmann, A unified framework for spiking and gap-junction interactions in distributed neuronal network simulations, 2015, Frontiers in Neuroinformatics, Vol. 9, Issue n/a, pages n/a, doi: 10.3389/fninf.2015.00022ꜛ
- D. Hansel, H. Sompolinsky, Chaos and synchrony in a model of a hypercolumn in visual cortex, 1996, Journal of Computational Neuroscience, Vol. 3, Issue 1, pages 7-34, doi: 10.1007/BF00158335ꜛ
- Shaul Hestrin, Mario Galarreta, Electrical synapses define networks of neocortical GABAergic neurons, 2005, Trends in Neurosciences, Vol. 28, Issue 6, pages 304-309, doi: 10.1016/j.tins.2005.04.001ꜛ
- Iris Ginzburg, Haim Sompolinsky, Theory of correlations in stochastic neural networks, 2002, Physical Review E, Vol. 50, Issue 4, pages 3171-3191, doi: 10.1103/PhysRevE.50.3171ꜛ
- Golomb, David, & Rinzel, John, Clustering in globally coupled inhibitory neurons, 1994, Physica D: Nonlinear Phenomena, 72(3), 259–282, doi: 10.1016/0167-2789(94)90214-3ꜛ
- Thomas Kreuz, Julie S Haas, Alice Morelli, Henry D I Abarbanel, Antonio Politi, Measuring spike train synchrony, 2007, Journal of Neuroscience Methods, Vol. 165, Issue 1, pages 151-161, doi: 10.1016/j.jneumeth.2007.05.031ꜛ
- Jaime G. Mancilla, Timothy J. Lewis, David J. Pinto, John Rinzel and Barry W. Connors, Synchronization of electrically coupled pairs of inhibitory interneurons in neocortex, 2007, The Journal of Neuroscience, Vol. 27, Issue 8, pages 2058-2073, doi: 10.1523/JNEUROSCI.2715-06.2007ꜛ
- Alberto E. Pereda, Electrical synapses and their functional interactions with chemical synapses, 2014, Nature Reviews Neuroscience, Vol. 15, Issue 4, pages 250-263, doi: 10.1038/nrn3708ꜛ
- Benjamin Pfeuty, Germán Mato, David Golomb, David Hansel, The Combined Effects of Inhibitory and Electrical Synapses in Synchrony, 2005, Neural Computation, Vol. 17, Issue 3, pages 633-670, doi: 10.1162/0899766053019917ꜛ
- Benjamin Pfeuty, David Golomb, Mato Germán Mato, David Hansel, Inhibition potentiates the synchronizing action of electrical synapses, 2007, Frontiers in Computational Neuroscience, Vol. 1, Issue n/a, pages n/a, doi: 10.3389/neuro.10.008.2007ꜛ
- S. Schreiber,, J.M. Fellous, D. Whitmer, P. Tiesinga, T.J. Sejnowski, A new correlation-based measure of spike timing reliability, 2003, Neurocomputing, Vol. 52-54, Issue n/a, pages 925-931, doi: 10.1016/S0925-2312(02)00838-Xꜛ
- Steven H. Strogatz, From Kuramoto to Crawford: exploring the onset of synchronization in populations of coupled oscillators, 2000, Physica D: Nonlinear Phenomena, Vol. 143, Issue 1-4, pages 1-20, doi: 10.1016/S0167-2789(00)00094-4ꜛ
- J. D. Victor, K. P. Purpura, Nature and precision of temporal coding in visual cortex: a metric-space analysis, 1996, Journal of Neurophysiology, Vol. 76, Issue 2, pages 1310-1326, doi: 10.1152/jn.1996.76.2.1310ꜛ
- Bennett, Zukin, Electrical Coupling and Neuronal Synchronization in the Mammalian Brain, 2004, Neuron, Vol. 41, Issue 4, pages 495-511, doi: 10.1016/s0896-6273(04)00043-1ꜛ
- NEST’s tutorial “Gap Junctions: Inhibitory network example”ꜛ
- NEST’s
hh_psc_alpha_gapmodel descriptionꜛ - NEST’s
gap_junctionsynapse type descriptionꜛ


comments