From calcium imaging to network dynamics: An overview
Modern neuroscience increasingly relies on large-scale functional imaging to observe neural activity across hundreds or thousands of cells simultaneously. Regardless of whether you acquire calcium imaging datasets yourself or work with data obtained from previous experiments or open repositories, the raw images themselves are only the beginning of the analytical process. The essential next step is to extract meaningful signals: first, by segmenting individual cells and deriving their calcium fluorescence traces over time. These traces, which reflect changes in intracellular calcium concentrations, serve as indirect proxies for neuronal spiking but are shaped by indicator kinetics and measurement noise.
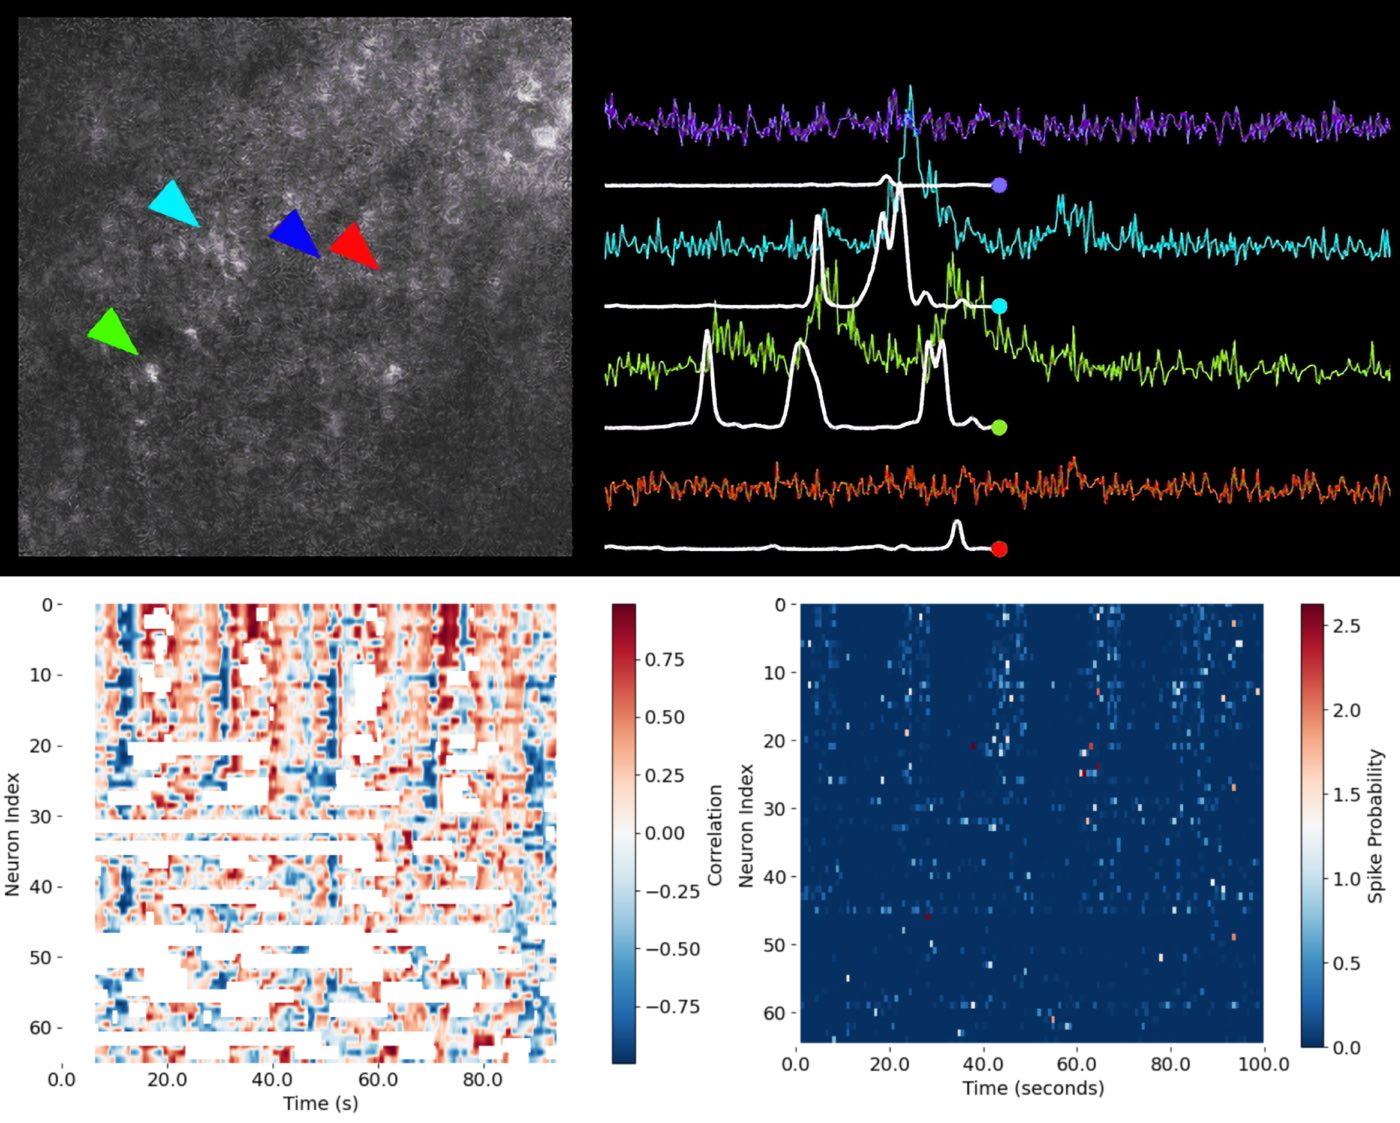
 Figure: From calcium imaging to functional population analysis. – Upper left: Example two-photon calcium imaging frame showing the neuropil and several identified neuronal somata (indicated by colored arrowheads: cyan, blue, red, and green). – Upper right: Extracted calcium fluorescence traces ($\Delta F/F$) for the neurons marked in the image, with their corresponding inferred spike probabilities (white lines) overlaid. Each color corresponds to a cell indicated by the matching arrowhead. This panel illustrates how raw imaging data is converted to fluorescence traces, and how computational methods extract spike timing information from noisy signals. – Lower right: Matrix of spike probability estimates for all recorded neurons over time. Each row corresponds to a neuron, and each column to a time point, visualizing the temporal evolution of activity across the neuronal population (network activity). – Lower left: Correlation matrix showing, for each neuron and time point, the correlation between single-neuron activity and the population (network) response. Red denotes positive correlation, blue denotes negative correlation, and white indicates uncorrelated activity or missing data. Together, these panels illustrate the workflow from raw calcium imaging, through spike inference, to the visualization and functional analysis of neural population dynamics. Source of upper panel images: CASCADE GitHub repositoryꜛ (license: MIT License)
To bridge the gap between calcium traces and actual neuronal activity, computational spike inference methods are applied. State-of-the-art approaches, such as deep learning-based algorithms, can reconstruct the underlying spike probability or firing rate from noisy and temporally blurred calcium signals. The output is a time series that much more directly reflects the neuronal firing patterns that underlie behavior and network computation.
With reliable spike probability estimates available for each neuron, the focus shifts to understanding the emergent properties of neural populations. Analytical techniques for population analysis—such as visualization, dimensionality reduction, correlation, and sorting—allow us to detect patterns, identify assemblies, and reveal the organizational principles governing network activity. Ultimately, the integration of these approaches enables the interpretation of neural circuit function, both at the level of single cells and in the context of the collective population dynamics that drive perception, cognition, and behavior.
By the end of this course, you will be able to address central questions such as:
- How can meaningful neuronal signals be extracted from large-scale calcium imaging data?
- What are the principles and limitations of inferring spike activity from calcium fluorescence traces?
- Which analytical methods reveal patterns and structure in the activity of neural populations?
- How do collective dynamics and functional assemblies emerge from the activity of individual neurons?
These skills form the foundation for interpreting complex neural datasets and understanding the functional organization of brain circuits.