Exploring connected notes: Local graph views for DEVONthink knowledge bases
My tool of choice for personal knowledge management has been DEVONthink for years. It offers a range of advanced features for managing and interlinking your knowledge, from automatic Wiki-links to AI-assisted classification. But while these connections can be powerful, they often remain hidden in the absence of a visual representation. I therefore created a tool that addresses that gap: it generates local, interactive graphs that reveal the immediate network of connections around a note. These graphs make it possible to explore clusters, detect structural patterns, and uncover relationships that may not be evident when reading notes in isolation. Built as a fully local solution and embedded directly into each note, the system brings spatial navigation to your Markdown-based knowledge network — lightweight, integrated, and designed for everyday use within DEVONthink 3. After refining it for my own purposes, I decided to share the tool with the broader community in the hope that others might benefit from the same clarity and structure it has brought to my own note-taking practice.
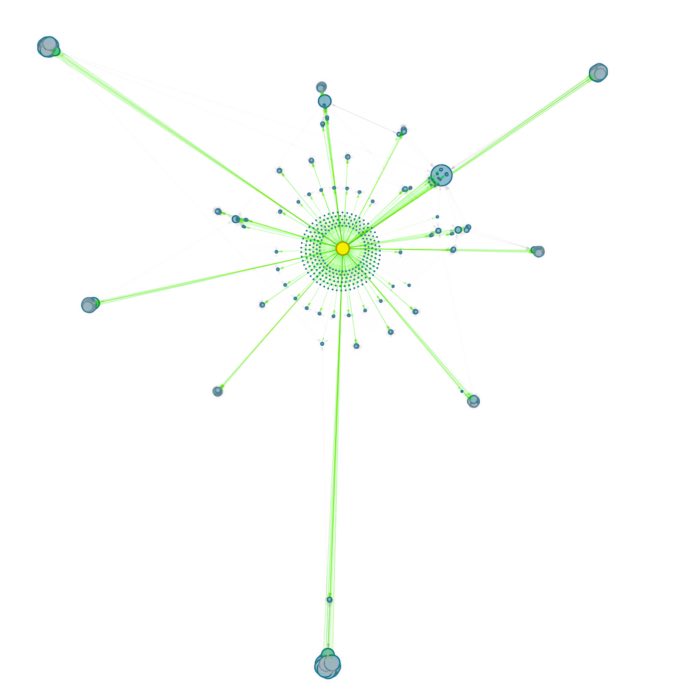
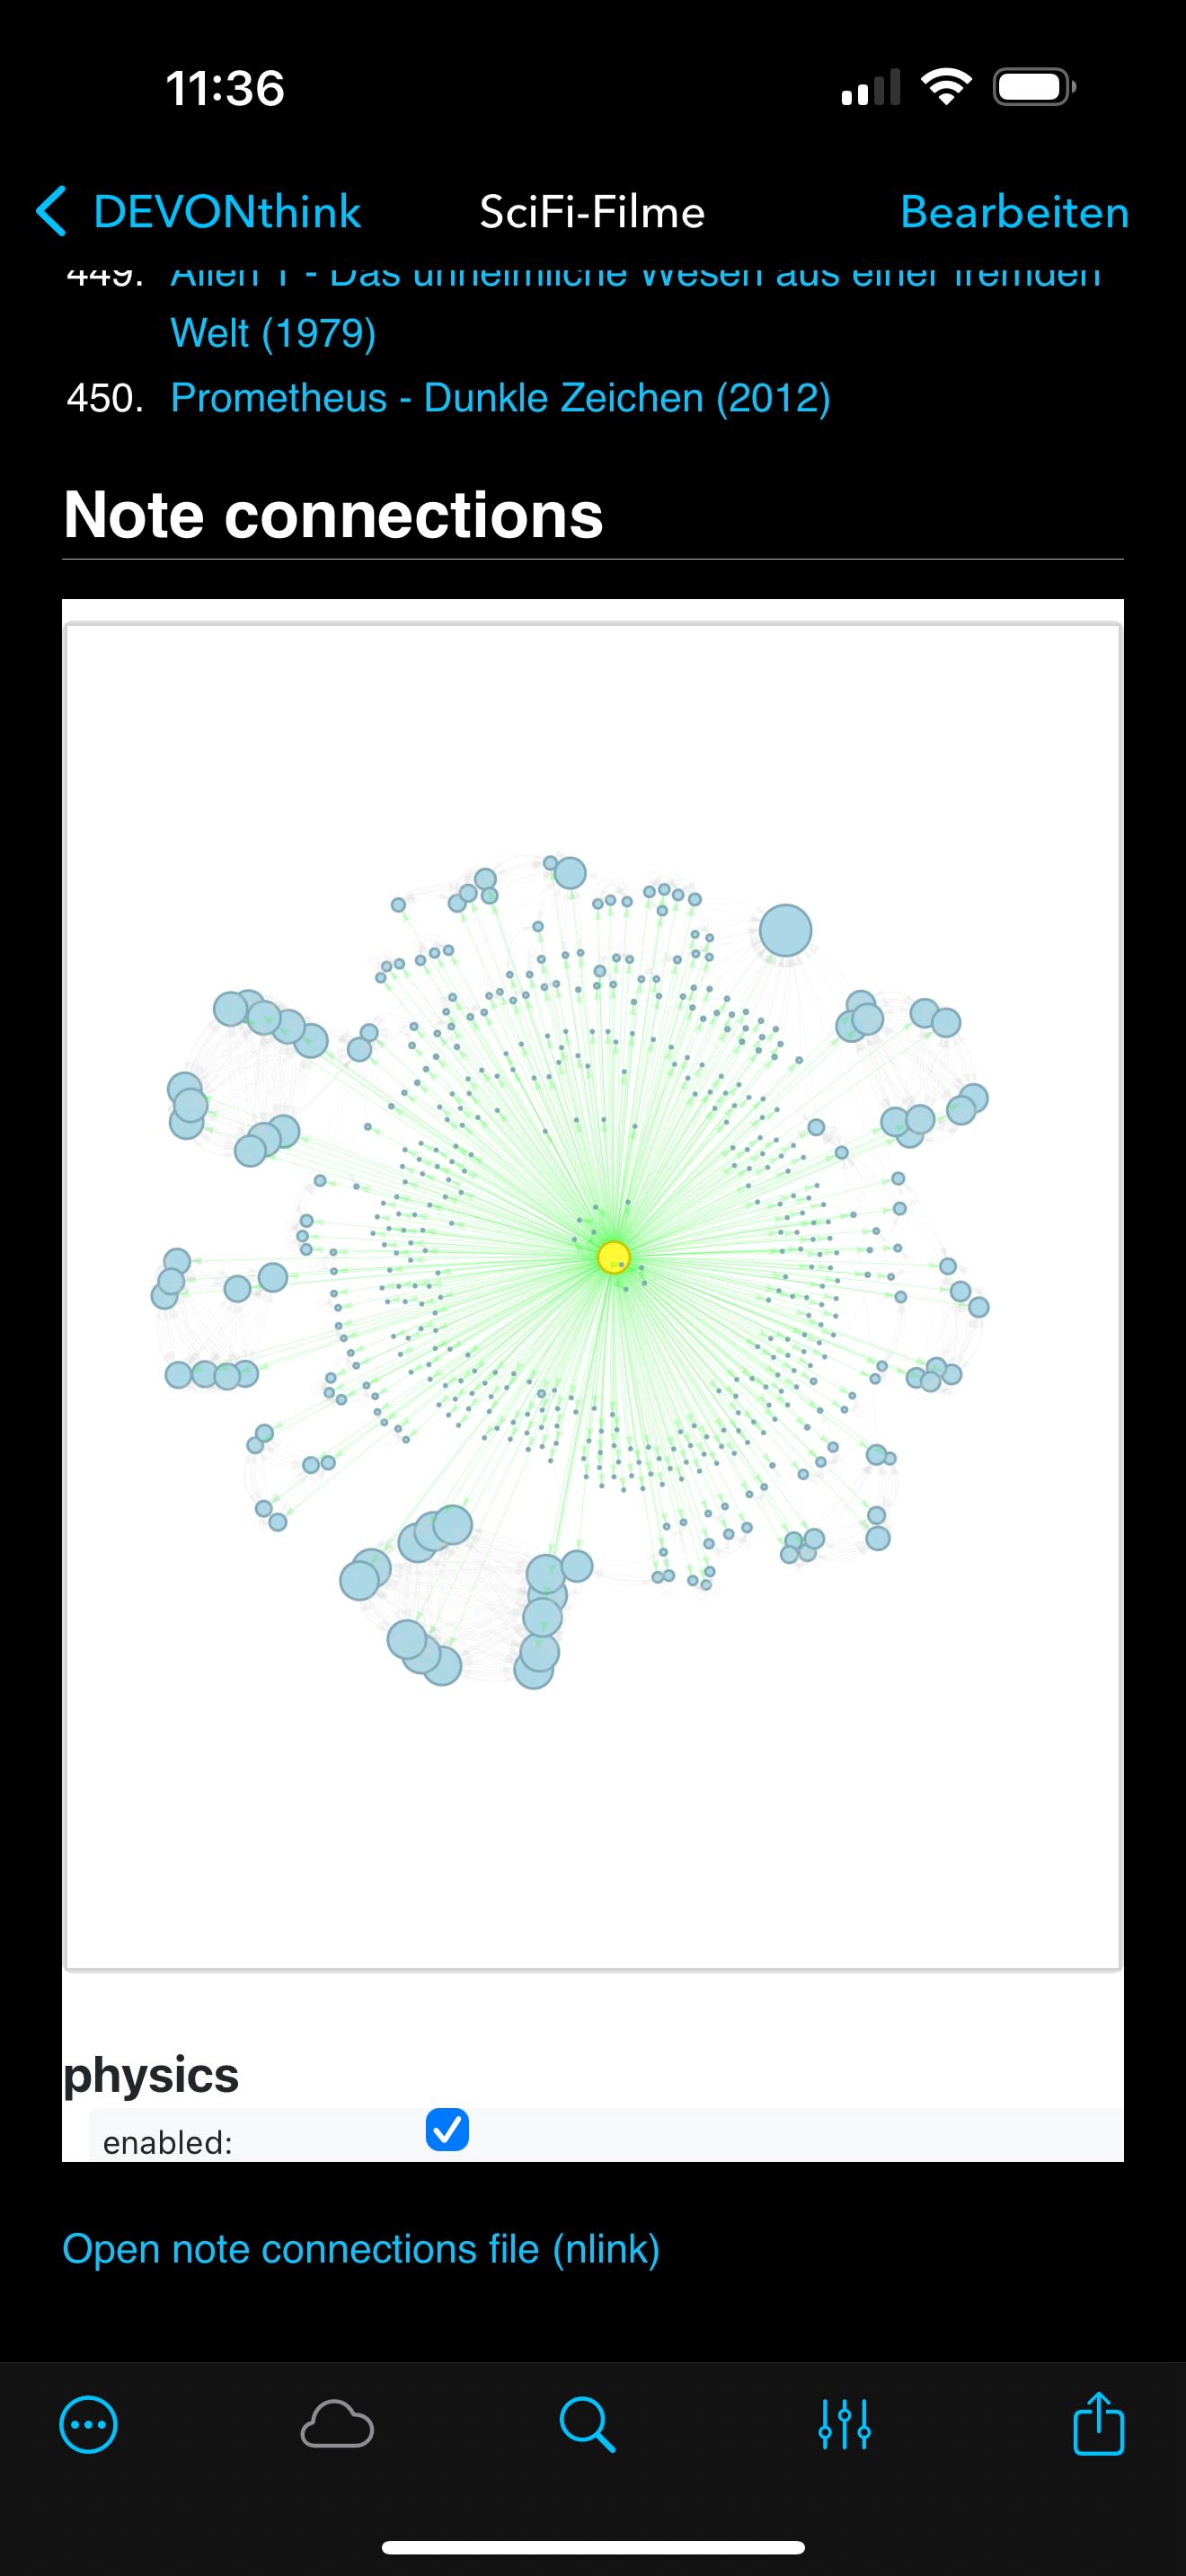
Example of a graph generated by the script, showing the local connections around a note, where I’ve listed all my favorite Science Fiction movies. The graph visualizes the immediate network of Wiki-links, revealing clusters and connections that might not be immediately obvious when reading the notes in isolation. The graph is generated using the networkx library and embedded directly into the note as an HTML file with an <iframe> integration. In the examples below, you can see how the graph looks when embedded directly into a DEVONthink note, allowing for interactive exploration of the connections and clusters.
Introduction
In my research and writing workflow, DEVONthink plays a central role. I use it not just for note-taking, but also for file management, OCR for scanned PDFs, AI-assisted classification, and seamless integration across macOS and iOS. One of its underappreciated strengths is the automatic detection of Wiki-links between Markdown files: when a note title matches a referenced word or phrase, DEVONthink creates an internal connection — no manual linking required. This suits my process of knowledge aggregation and generation perfectly, as it allows me to stay focused on content without worrying about maintaining a formal network structure.
However, while DEVONthink excels in these areas, it lacks a visual interface to explore these automatically created connections. I found myself wishing for a way to see clusters, loops, and bridges that might have emerged from my note corpus — especially in a Zettelkasten-like setup where insight often arises from structural proximity.
Of course, there are tools like Obsidian that offer graph views out of the box. But I didn’t want to maintain two separate systems or lose DEVONthink’s features like document-level AI suggestions, flexible file handling, or automatic Wiki-link detection. So I started experimenting with connection visualizations on my own.
I tried AppleScript alone, then JavaScript for Automation (JXA), and finally found a workable approach after discovering the pydt3 module — a Python interface to DEVONthink. This opened the door to powerful libraries like networkx for graph modeling, pyvis for visualization, and joblib for parallelization.
After several iterations and days of testing in my own setup, I ended up with a script that creates a visual graph of incoming and outgoing Wiki-links around a selected note, including cross-links between its neighbors. The resulting HTML graph is embedded directly into the note (via an iframe integration), making it easy to explore ideas spatially and discover connections I hadn’t consciously made. I thought this tool might be useful to others as well — especially for surfacing clusters and latent structures that can spark new associations or insights.
The script is now available on GitHubꜛ and works reliably with DEVONthink 3. At the time of writing, it does not yet support DEVONthink 4, as the pydt3 module has not been updated for the new version. While the technical details and installation steps are explained thoroughly in the README of the repository, I wanted to use this post to share the conceptual motivation and design philosophy behind the project in greater depth.
Concept
At the heart of this tool lies a simple but powerful idea: meaningful structure can emerge naturally from how notes refer to one another. In DEVONthink, Wiki-links act as the connective tissue of thought — they form spontaneously when one note mentions the title or alias of another. Over time, this creates a web of implicit associations that reflect the actual flow of your thinking more accurately than any imposed taxonomy.
The graph generated by the script visualizes what I call the “level 1 neighborhood” of a selected note. It shows all notes that link to or are linked from the chosen note, as well as any cross-links that exist among these neighbors. In other words, it maps not only direct relationships, but also the local connective patterns within that immediate cluster.
This focused approach offers a high signal-to-noise ratio. Instead of showing your entire database — which would be overwhelming — it brings into view only the most contextually relevant material. Whether you’re exploring a topic cluster, preparing to write, or trying to reconnect fragments of an old project, this kind of local graph gives you a clear visual field for navigating your ideas.
Performance considerations
Another major focus during development was to keep the entire process computationally lightweight and responsive. I took three main measures to ensure this:
- Adaptive scaling: The script determines whether the selected graph will be “small” or “large” based on the number of connected notes and adjusts layout parameters accordingly. This ensures that small graphs remain compact and fast, while larger graphs are spread out more gradually to avoid clutter and sluggish rendering.
- Parallelization: Using the
jobliblibrary, the script distributes the link resolution and connection analysis across multiple CPU cores. This significantly speeds up the processing, especially for notes with many neighbors. - Two-stage visualization: The script combines two network libraries —
networkxis used to calculate a pre-rendered static layout, whilepyvisoffers dynamic, browser-based physics simulation. The latter is optional and can be toggled on by the user. This approach allows every graph to load smoothly in DEVONthink, without heavy computation unless explicitly requested.
These choices were guided by the goal of making the script usable for daily note interaction — not just for analysis, but as an embedded part of my working environment.
The technology stack
The script generates an HTML file called nlink_<UUID>.html that represents the local connection graph of the selected Markdown note. These graph files are automatically saved into a folder named _nlinks, which the script creates if it doesn’t already exist. The selected note itself is updated to include or replace an <iframe> block that embeds the generated HTML, making the graph view directly accessible inside the note.
Technically, DEVONthink does not allow overwriting existing HTML files via the pydt3 Python interface. For this reason, the script deletes any existing file with the same name and creates a fresh HTML record every time it runs. This also means that the embedded link in the note must be updated to reflect the newly created file’s UUID.
All core processing is done by the Python script: it handles record selection, link resolution, graph construction, layout generation, and output. The only role of the AppleScript is to serve as a launcher — it activates the appropriate Conda environment and runs the Python script. This separation keeps the logic clean and makes it easy to adjust or extend either part independently.
These embedded graphs also work seamlessly in DEVONthink To Go on iOS/iPadOS. The static layout loads instantly, and even the interactive pyvis physics simulation is fully functional within the mobile browser context. This means you can explore and interact with your note networks on the go — although the script itself must be run on the desktop to generate or update the visualizations.
Examples
To illustrate how the script works in practice, here is an example from my own note collection. The note titled SciFi-Filme contains entries about science fiction movies I’ve watched or want to watch. This category itself is useful — but what’s far more interesting is how it structurally connects to other areas of my note archive:
- The first graph (screenshot at the top of this post) shows the static
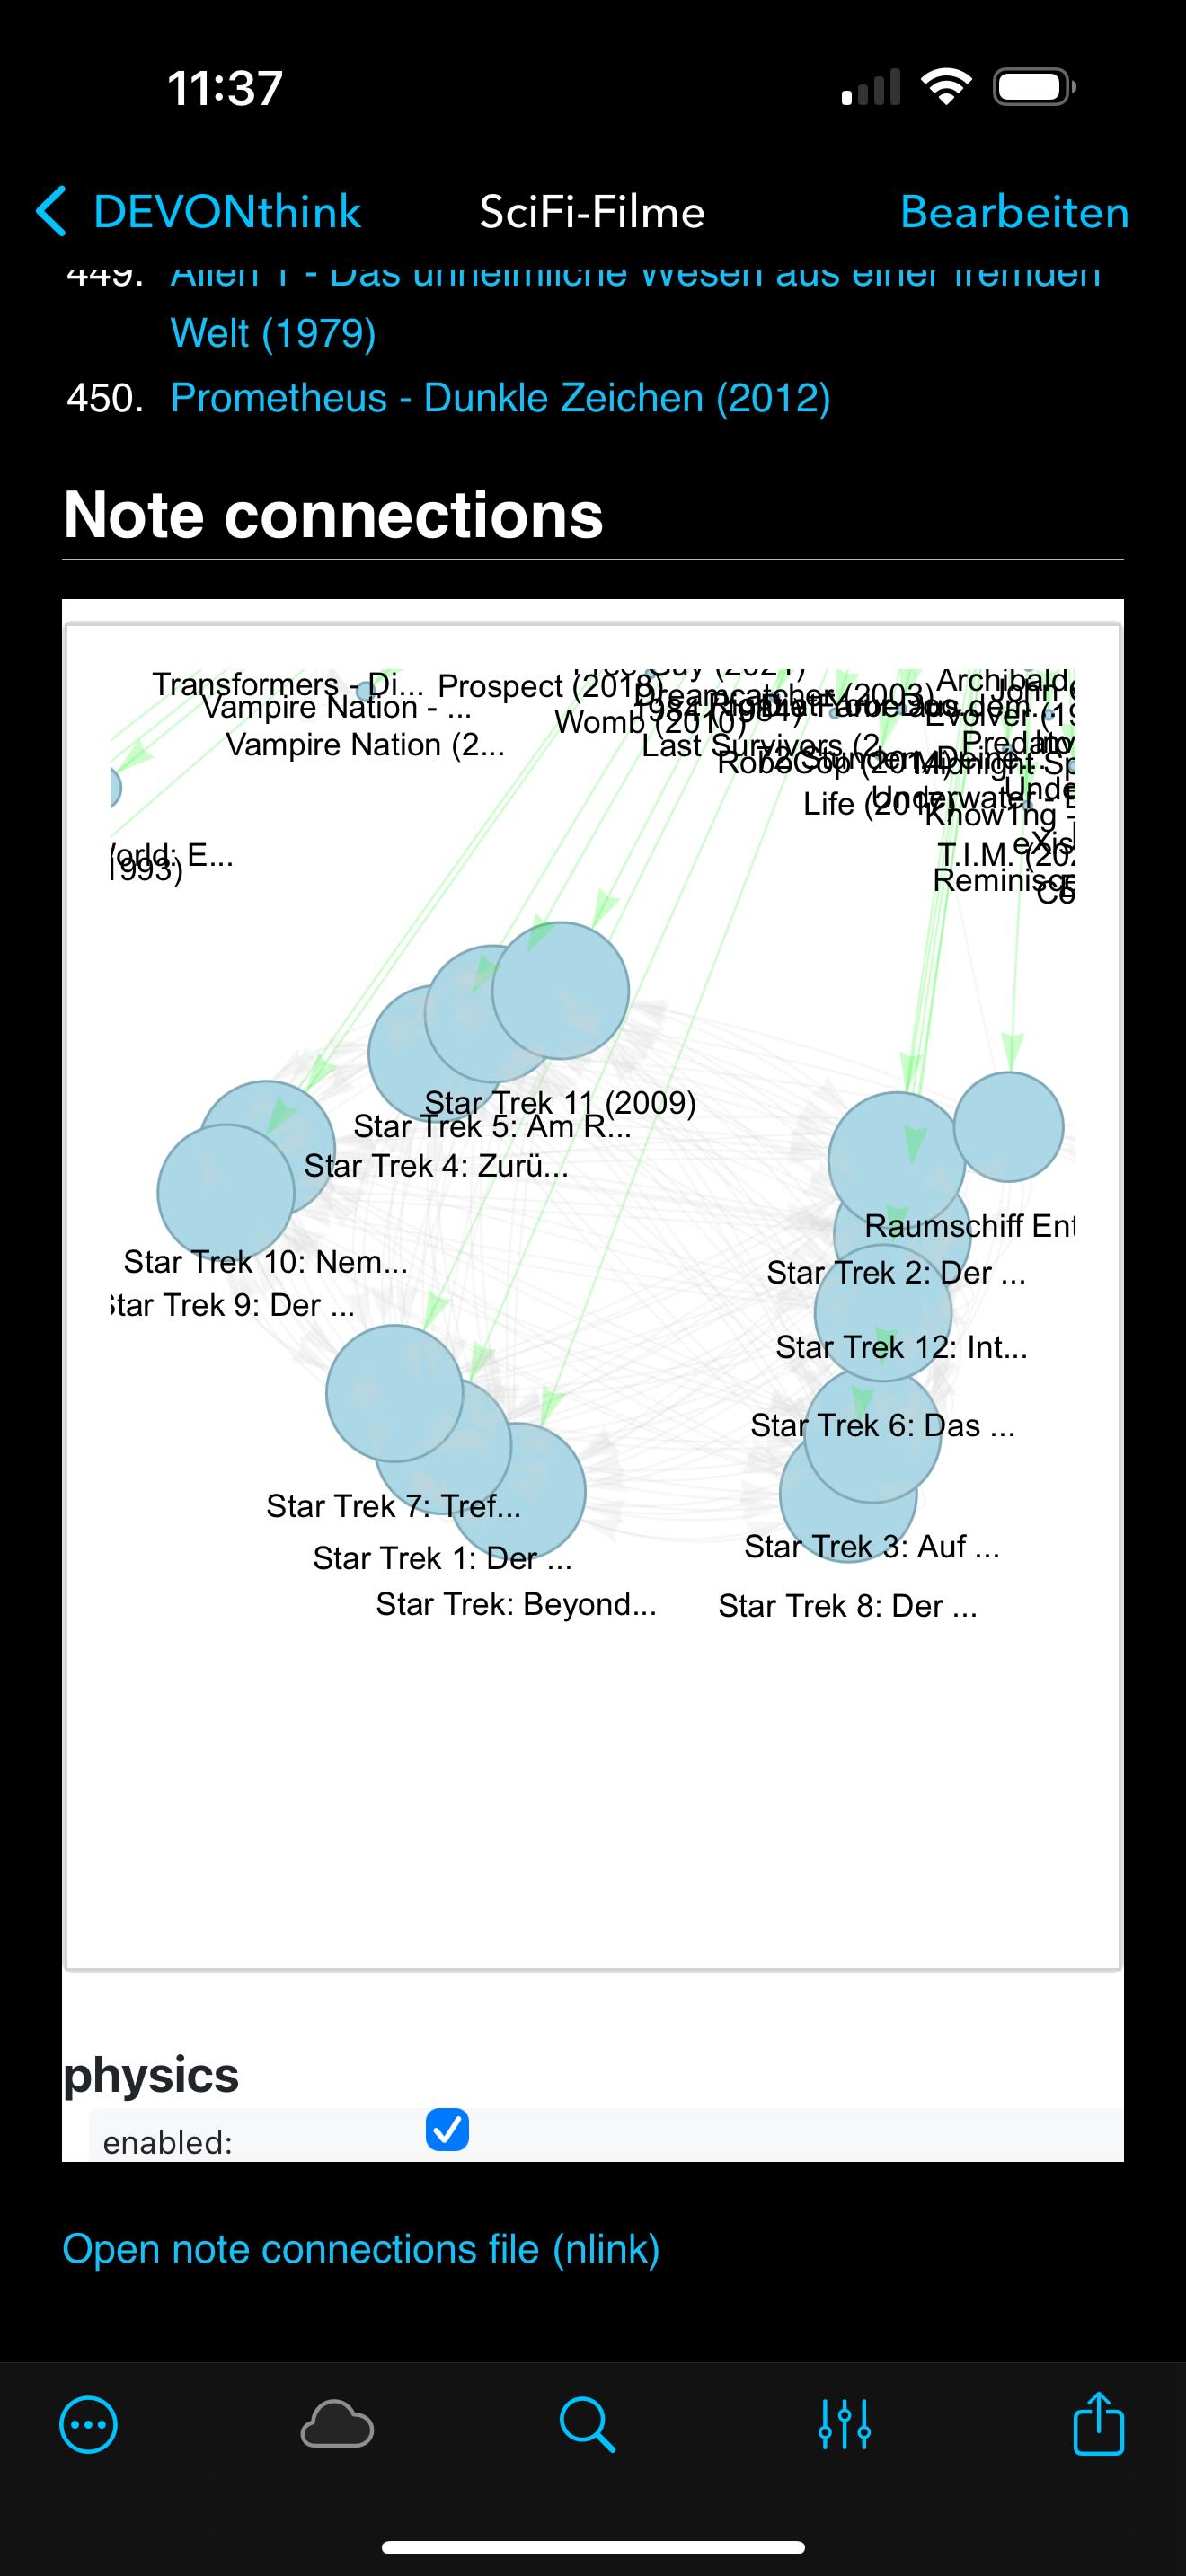
networkxlayout: a clean radial overview centered around the SciFi-Filme note, with all direct neighbors and visible cross-links. - Enabling physics simulation via
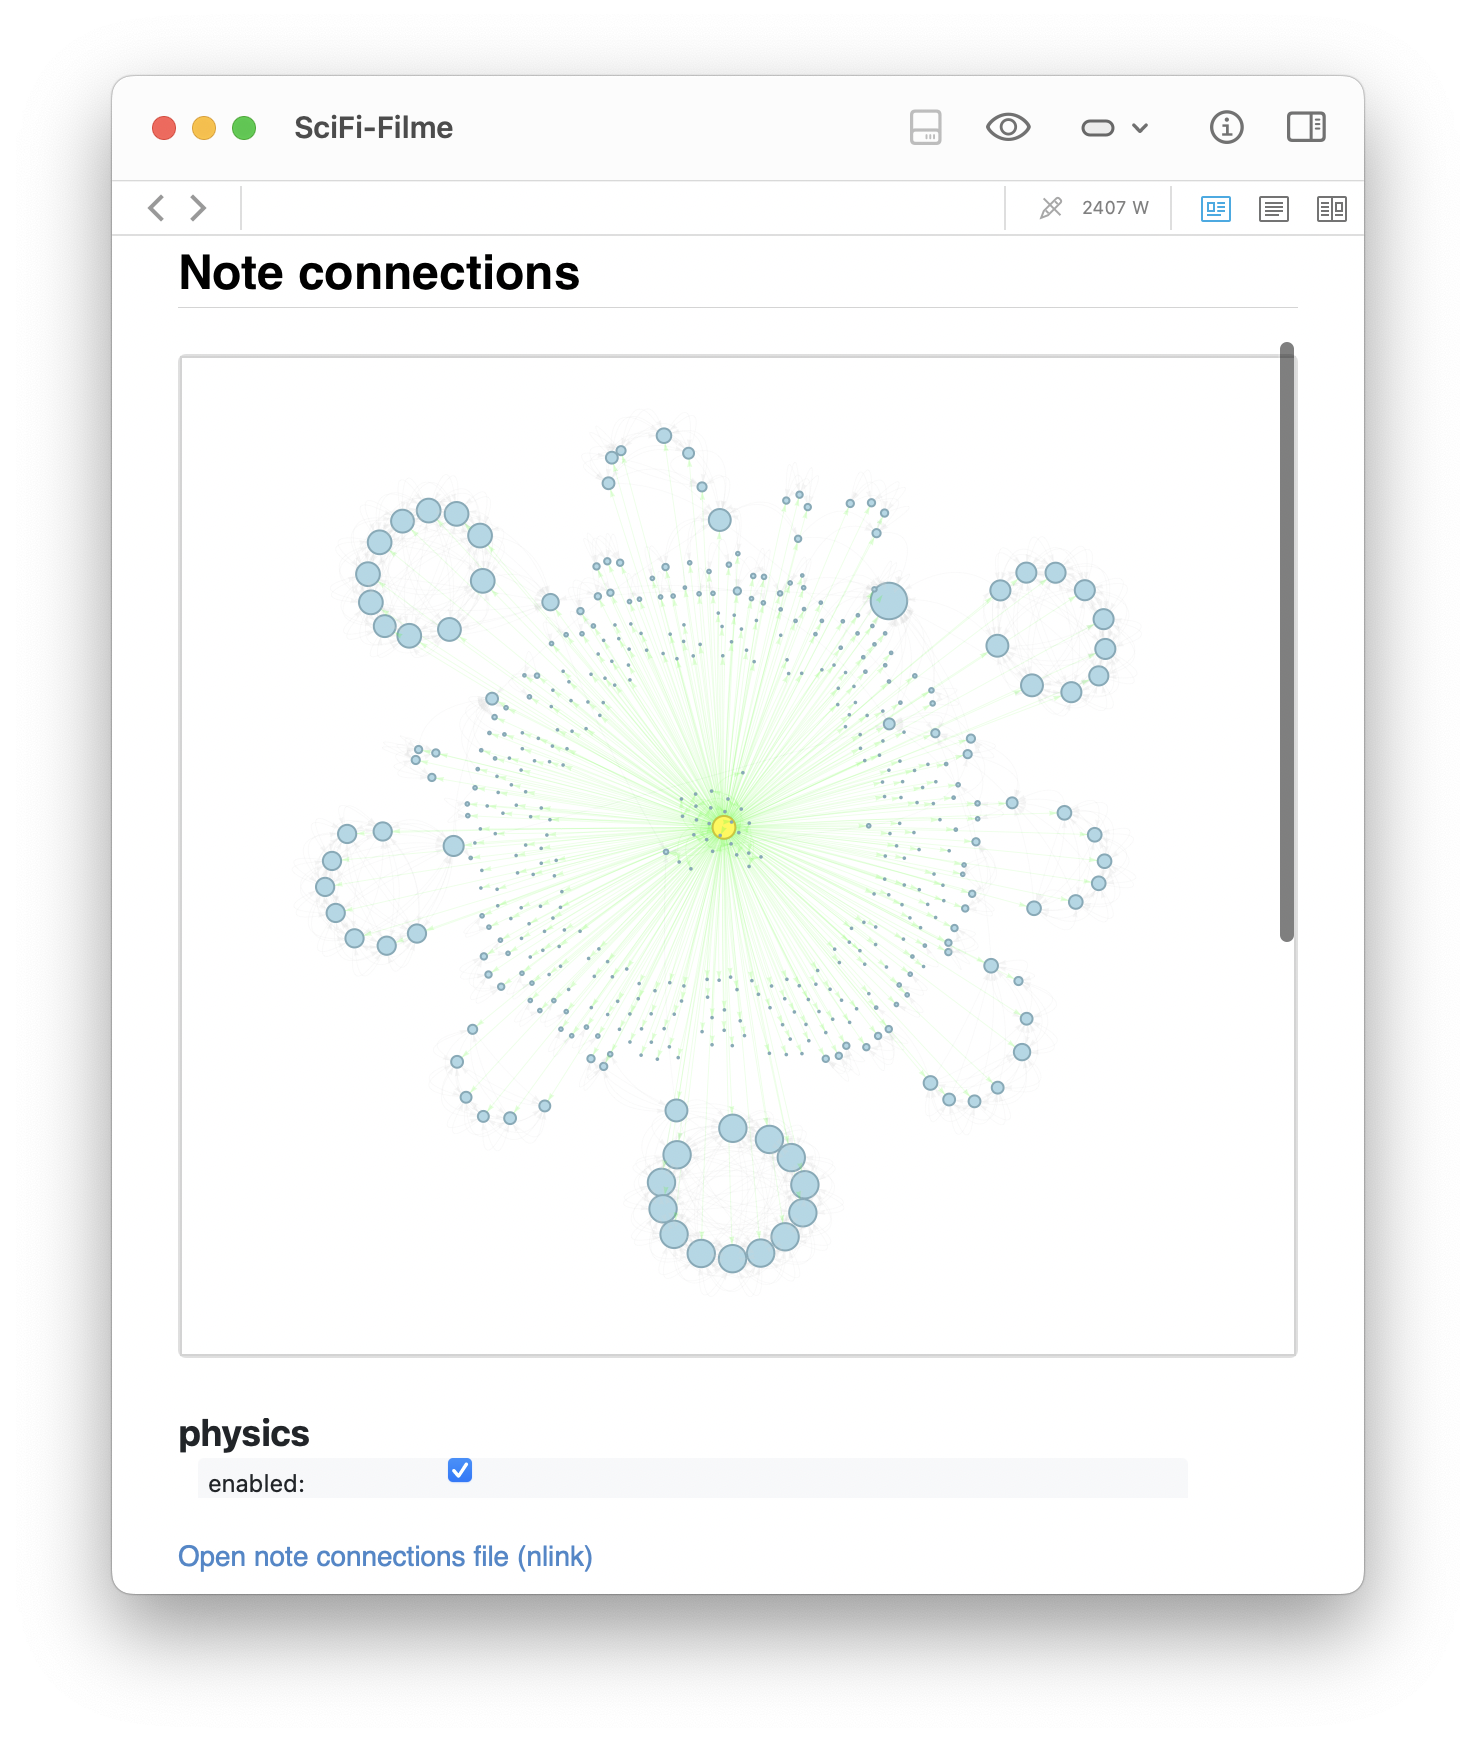
pyvisproduces the second view, where the clusters naturally repel into formations based on connection strength. - Zooming in reveals distinct subclusters — for instance, a clear Star Wars cluster that, interestingly, links to a note about Ritter (Knights), suggesting a thematic bridge.
- Another zoomed-in view highlights a Terminator cluster that unexpectedly shares structural proximity with a note on Soteriology, a connection I had not consciously made.
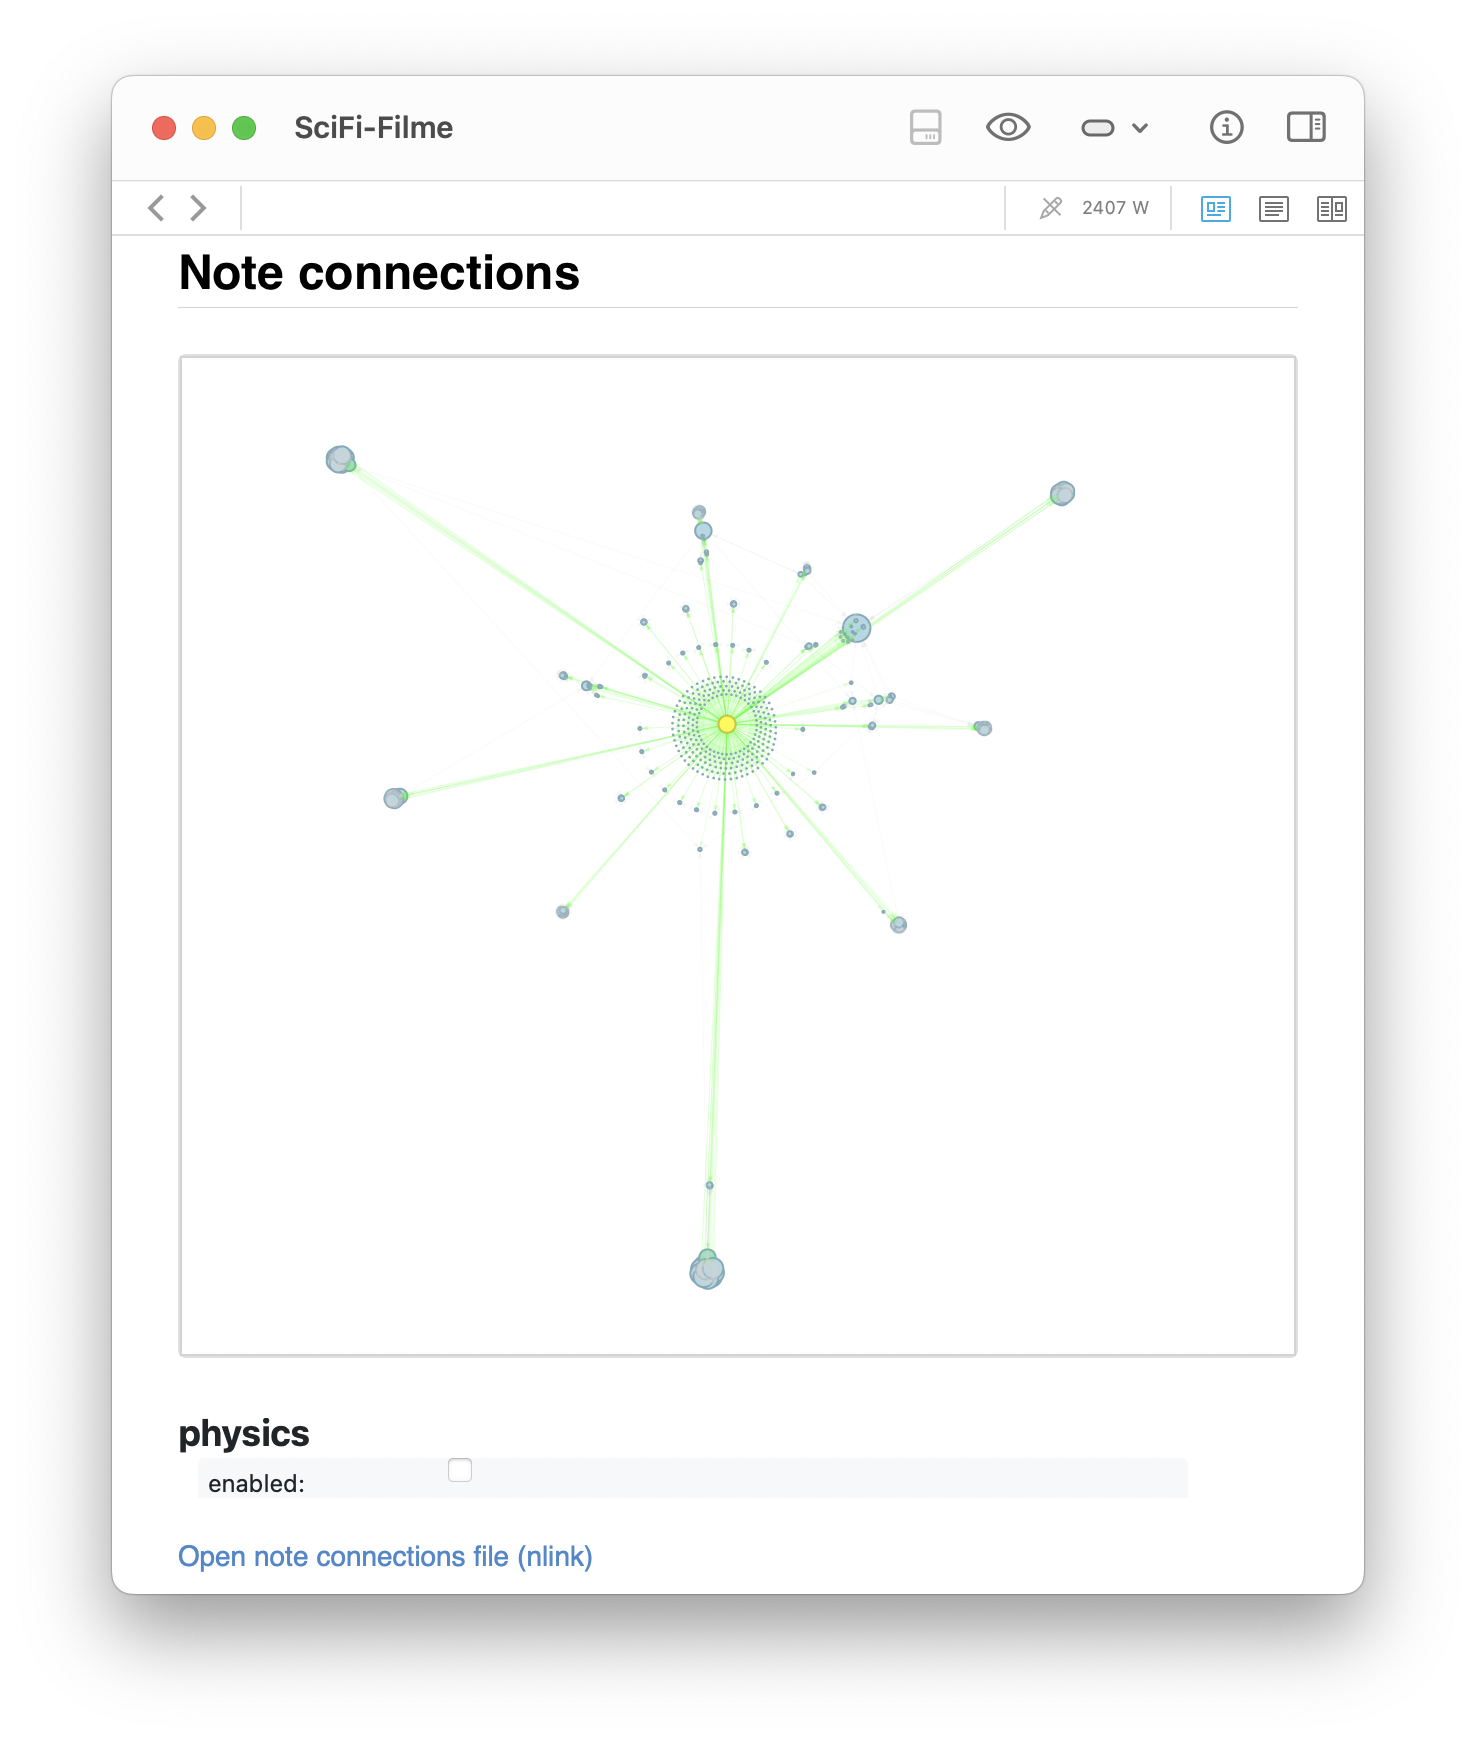
The generated graph for the SciFi-Filme note as above. The left image shows the static networkx layout: a clean radial overview centered around the SciFi-Filme note, with all direct neighbors and visible cross-links. The right image shows the same graph with physics simulation enabled via pyvis, where the clusters naturally repel into formations based on connection strength.
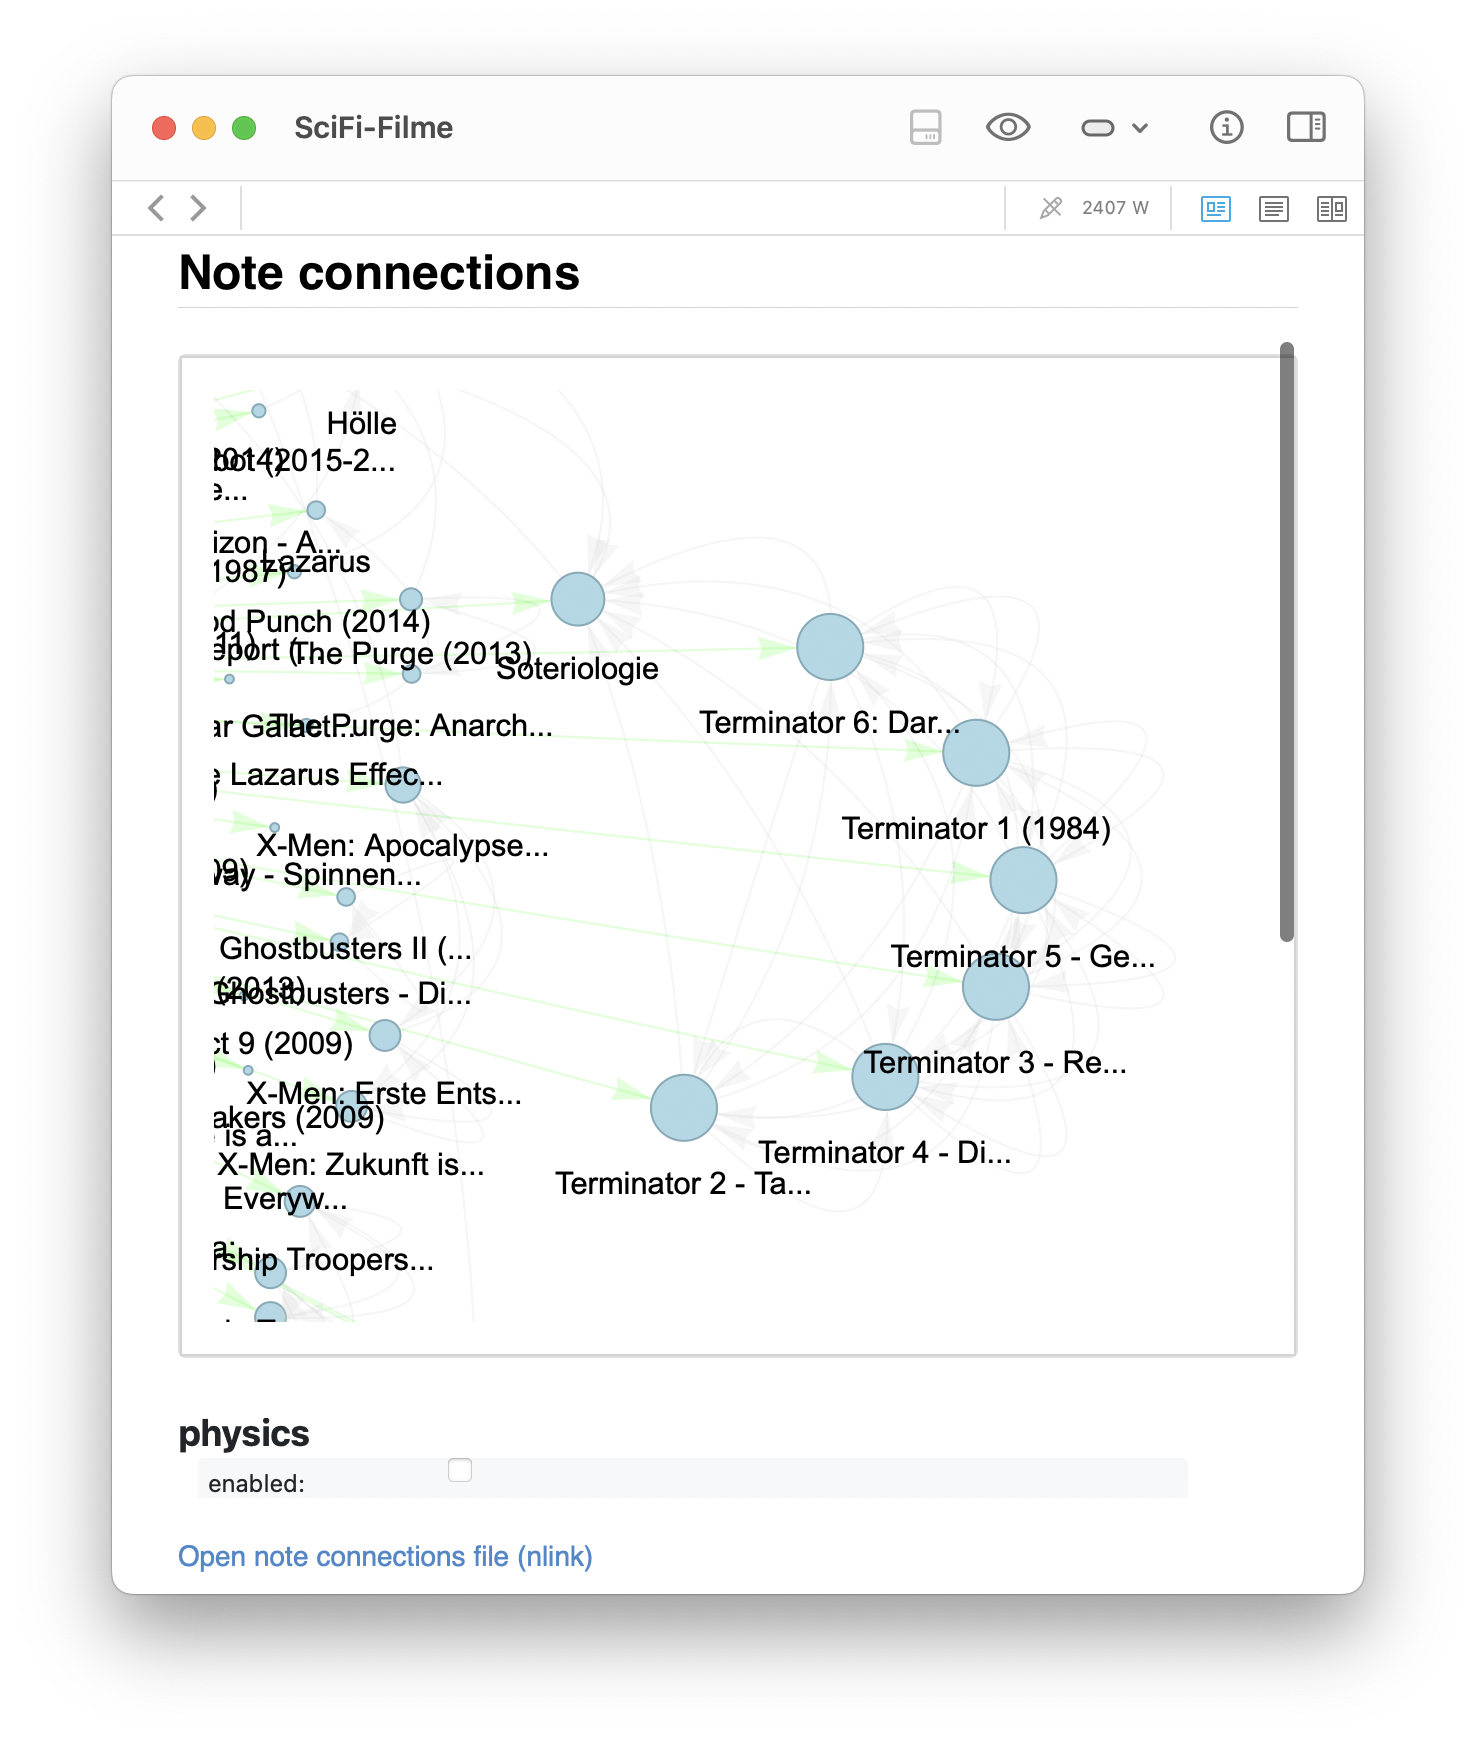
Zoomed-in views of the generated graph for the SciFi-Filme note, showing distinct clusters. The left image highlights a Star Wars cluster that links to a note about Ritter (Knights), suggesting a thematic bridge. The right image shows a Terminator cluster that unexpectedly shares structural proximity with a note on Soteriology, a connection I had not consciously made.
These graphs show not only how information is clustered, but also how seemingly distant topics can become linked through intermediate associations — providing a fertile ground for new insight.
A second example shows a more serious topic: my note on Koffein und Tee (caffeine and tea). The full graph shows how the note is linked both to specific tea types (e.g., Sencha, Gyokuro, Matcha) and to biological concepts such as Aminosäuren (amino acids), Adrenalin (adrenaline), and the Zentralnervensystem (central nervous system). In the zoomed-in pyvis simulation, one can observe a clear separation of subclusters — a tea-related cluster on the right and a biology-related cluster on the left. This confirms that emergent structure in the graph reflects conceptual domains. Even in small note collections, these structures help clarify and integrate one’s thinking.
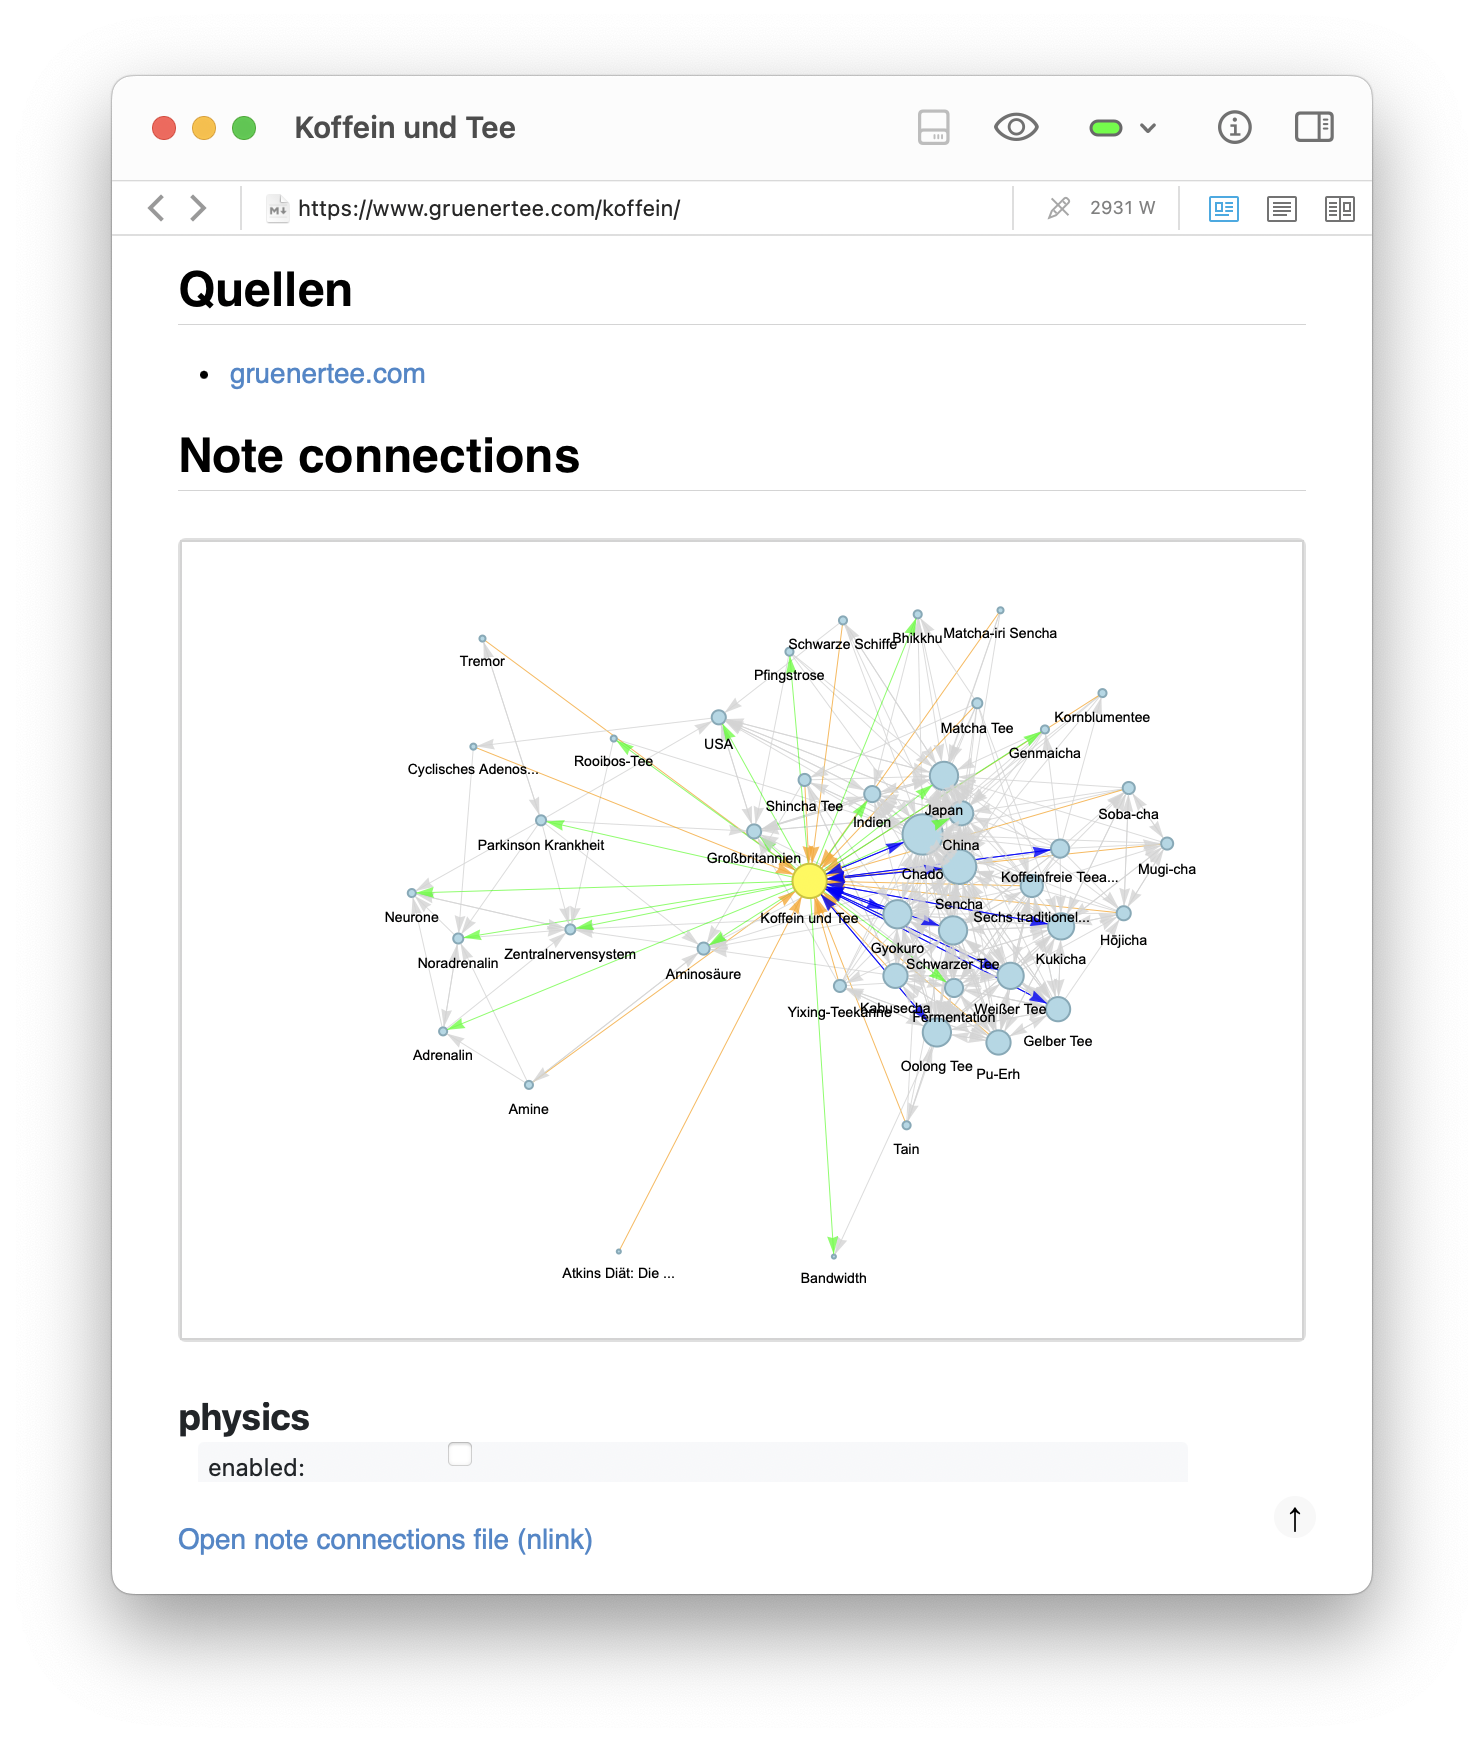
Graph of another note, this time about Koffein und Tee (caffeine and tea). The graph shows the local connections around the note, revealing clusters and connections that might not be immediately obvious when reading the notes in isolation. The graph is generated using the networkx library and embedded directly into the note as an HTML file with an <iframe> integration.
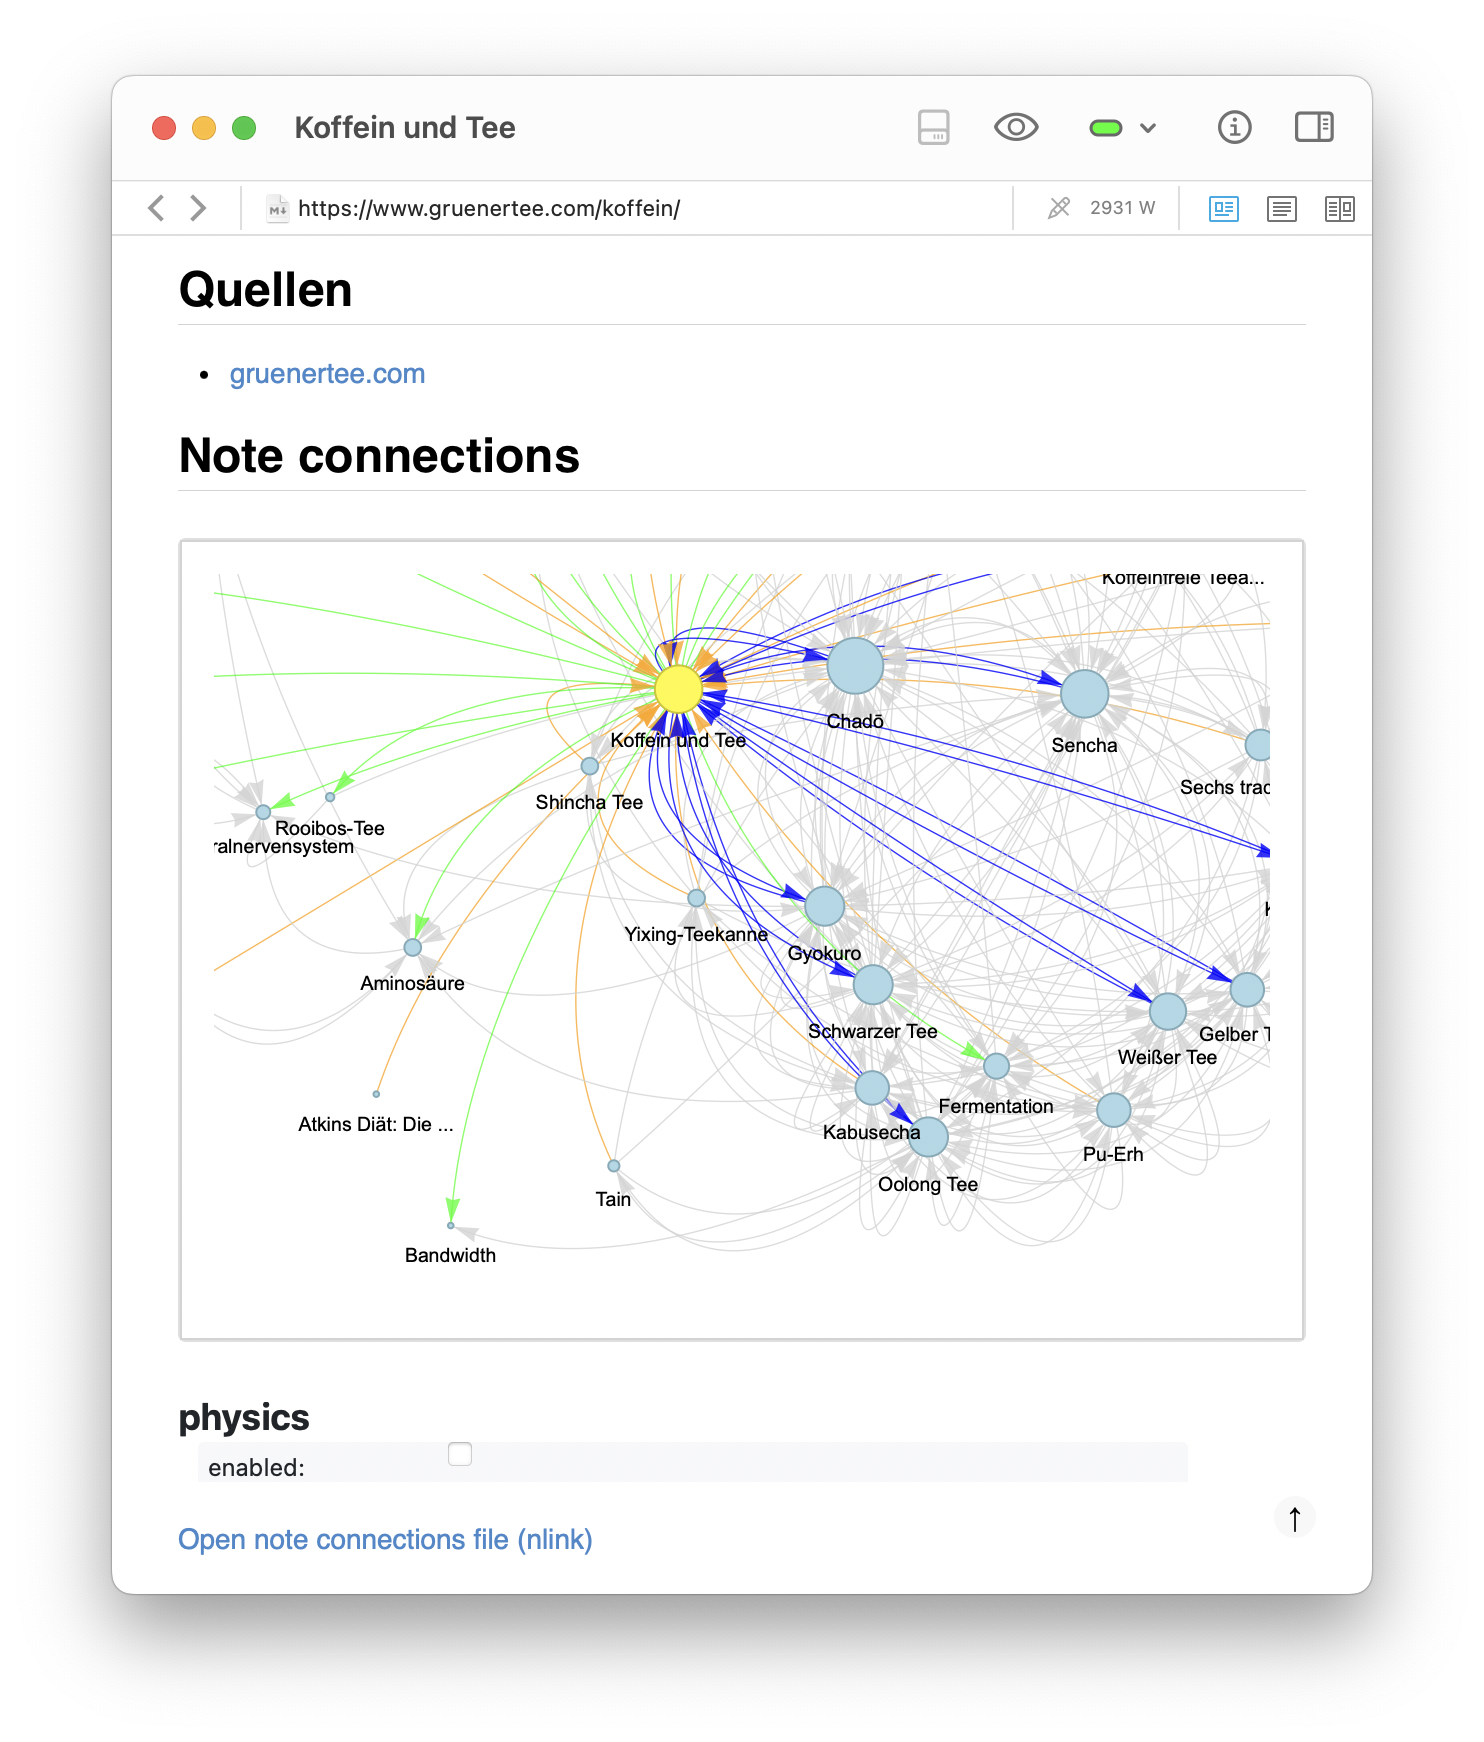
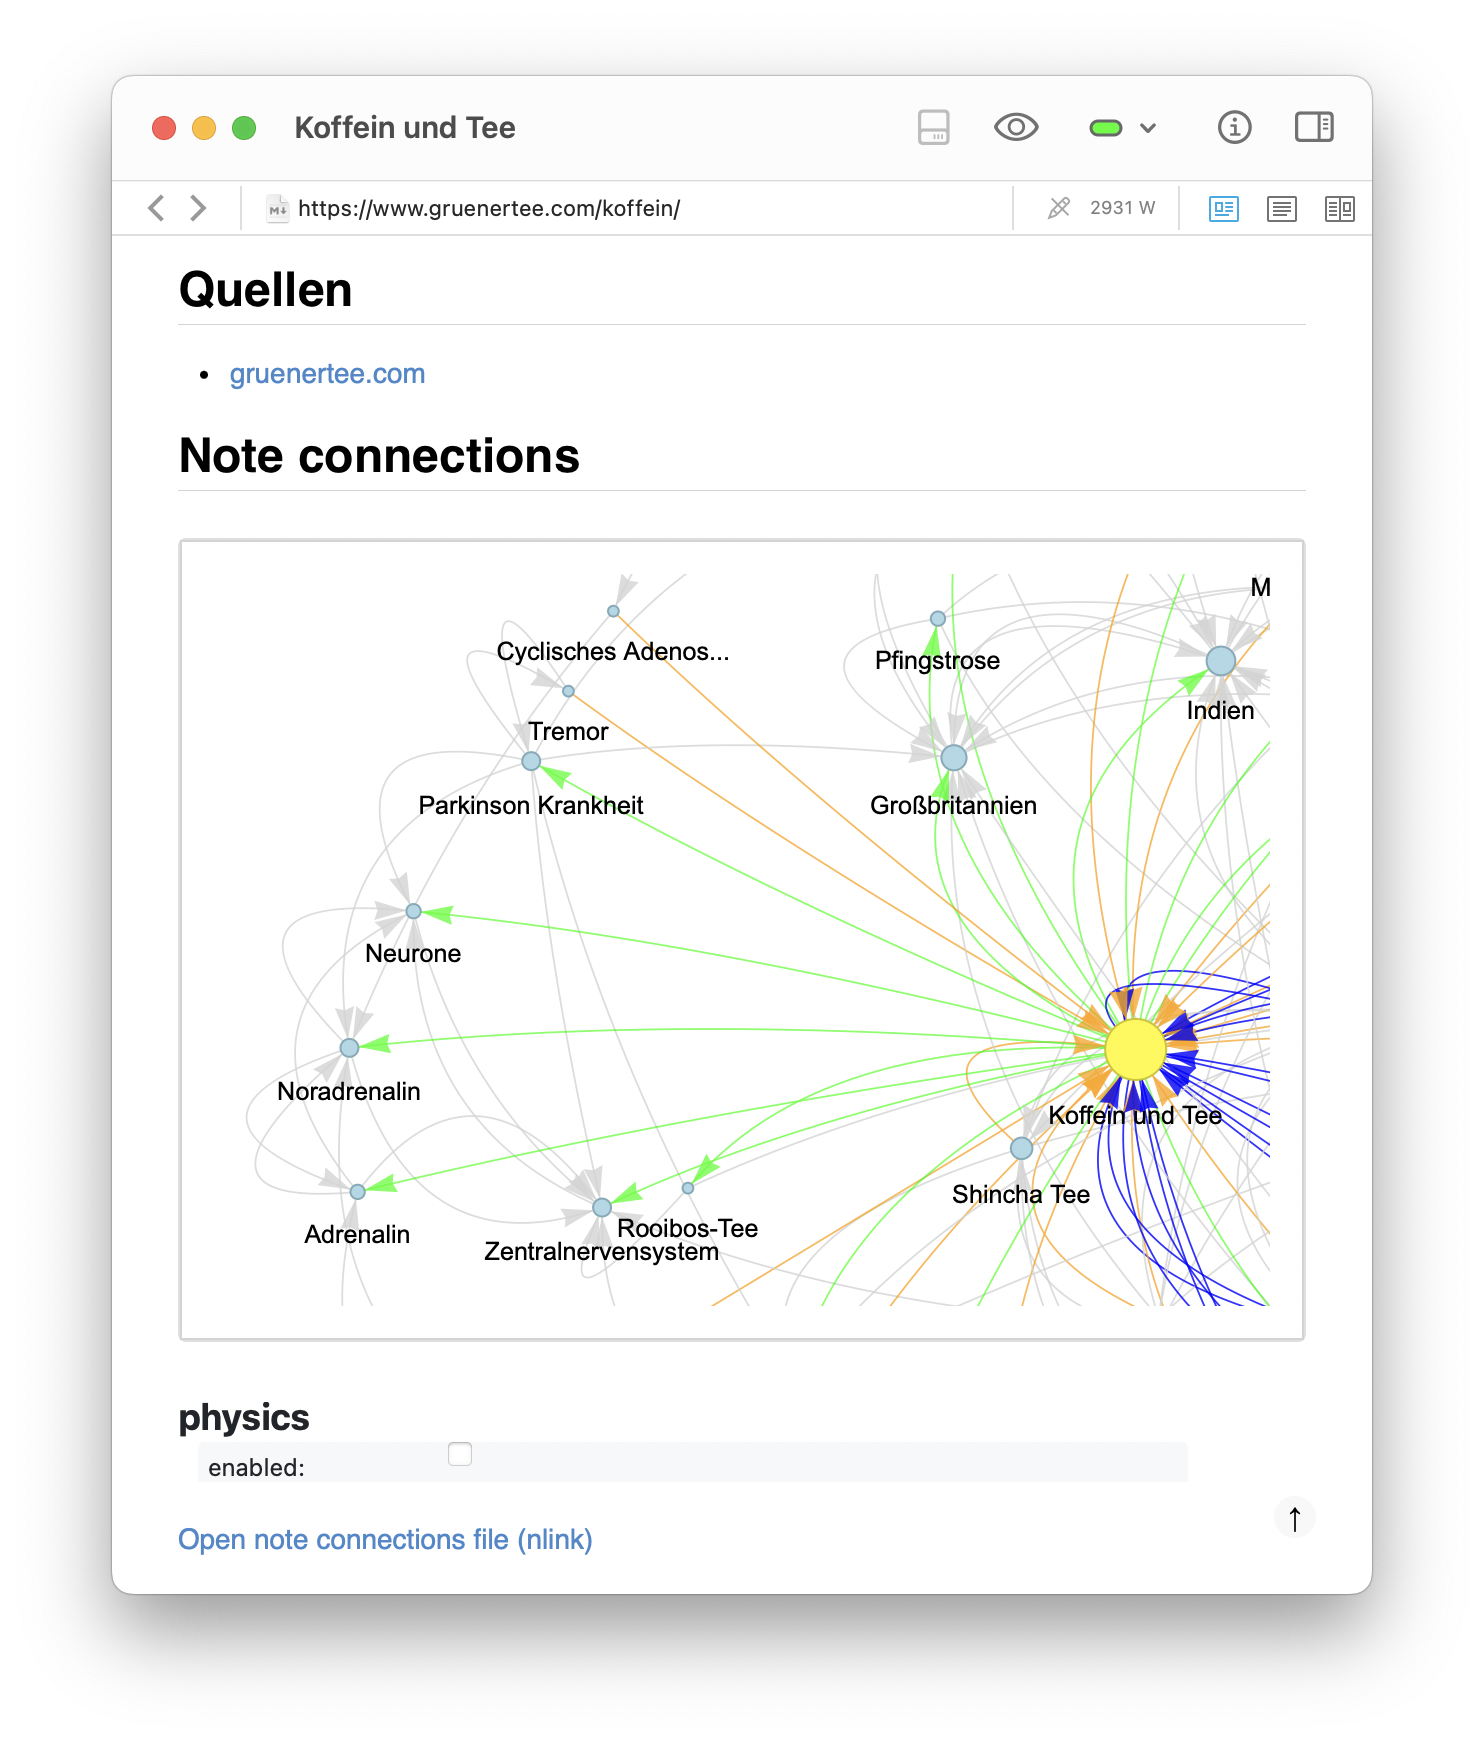
Zoomed-in views of the generated graph for the Koffein und Tee note, showing distinct clusters. Both images highlight the separation of subclusters: a tea-related cluster on the right and a biology-related cluster on the left. This confirms that emergent structure in the graph reflects conceptual domains, helping to clarify and integrate one’s thinking.
Want to see the generated graph in action? Here’s how it looks when embedded directly into a DEVONthink note:
This is an example of how the generated graph looks when embedded directly into a DEVONthink note. The graph is interactive, allowing you to explore the connections and clusters visually. You can zoom in and out, drag nodes around, and click on them to see more details about the connected notes. In this example integration, all links are deactivated. However, in the actual implementation, clicking on a node will open the corresponding note in DEVONthink.
And of course, you can view, navigate and interact with these graphs also on your iOS or iPadOS devices using DEVONthink To Go:
The same SciFi-Filme graph as above, but viewed on iOS using DEVONthink To Go. The graphs are fully interactive, allowing you to explore clusters and connections just like on the desktop version. The physics simulation works seamlessly in the mobile browser context, providing a dynamic view of your note networks.
Clicking on a node: You can click on any node in the graph to open the corresponding note in DEVONthink. Alternatively, you can wait for the tooltip to appear, which shows the note title and allows you to click on it to open the note. This works seamlessly on macOS. On iOS/iPadOS, however, clicking on a node will not open the note. At the moment, I don’t have a solution for this, but you can still use the tooltip to see the note title and click on it, it contains a link to the corresponding note. The tooltip appears after a short delay when you click on a node. However, also this is sometimes a bit finicky on iOS, so you may need to try clicking a few times to get it to show up. Whenever I have a solution for this, I will update the script accordingly. Or if you have a solution, feel free to open an issue on the GitHub repository.
Reflections
Building this tool has been an instructive experience on multiple levels. On the technical side, I learned a great deal about interacting with DEVONthink programmatically via pydt3, especially how to navigate its constraints — such as the inability to overwrite records directly. It was also the first time I combined networkx and pyvis in a single visualization pipeline, and the process of tuning layout and physics parameters to accommodate different graph sizes was unexpectedly delicate but rewarding.
From a design perspective, the biggest takeaway was how powerful a local, focused graph can be — not as a global map of everything, but as a lens to explore a conceptually bounded space. Limiting the view to the immediate neighborhood of a note helps avoid the noise that typically burdens larger graph visualizations and keeps the cognitive load low while still offering valuable insight.
There are still several directions I’d like to explore. These include recursive depth modes (e.g., showing second-degree neighbors) and optional tag-based augmentation of the graph. However, I wanted to keep the initial implementation simple and focused on the core idea of local connectivity. The current version is already quite powerful for everyday use, and I think it strikes a good balance between flexibility and usability.
I deliberately chose to keep everything local — not just because it simplifies the architecture, but also to preserve privacy, ensure speed, and integrate natively with DEVONthink’s file model. I think this balance of flexibility and simplicity is exactly what makes the solution practical for everyday use. The result is a solution that feels lightweight and native, not like an external analytics tool grafted onto your notes.
Conclusion
This project emerged from a personal need: I wanted to make the structure of my note collections in DEVONthink more accessible, navigable, and meaningful — without abandoning the strengths of the platform. The result is a lightweight script that integrates directly into your daily workflow, visualizing the web of connections that already exists in your knowledge base but often remains hidden.
By focusing on the immediate neighborhood of a note, the tool avoids the complexity and clutter of global graph views, while still surfacing valuable patterns: reciprocal links, thematic clusters, and surprising structural bridges. With adaptive performance features, automatic integration into the note itself, and full compatibility with DEVONthink 3, it is designed to be both practical and unobtrusive.
If this sounds useful to you, feel free to explore the GitHub repository, try it out in your own workflow, and share your feedback or suggestions. I hope it helps you see — quite literally — the structure of your thinking.

comments