Tracking cell migration
If you haven’t installed Napari yet, please do so before proceeding with this tutorial. To practice this tutorial, install the following package(s) in your activated Napari conda environment:
mamba install -y napari-assistant napari-simpleitk-image-processing napari-laptrack
Introduction
Cell migration refers to the process by which individual cells move from one location to another within a living organism. It is a fundamental biological phenomenon that plays a crucial role in various physiological and pathological processes. Cell migration occurs in diverse contexts, such as embryonic development, wound healing, immune responses, tissue regeneration, and cancer metastasis. Tracking this migration is an important aspect of biomedical research as it helps us to understand how cells move within living organisms. By studying individual cells as they navigate through the tissues, we can gain insights into processes such as development, tissue regeneration, immune responses, and disease progression. Cell migration can be tracked in-vivo using time-lapse microscopy and there are several techniques available to quantify cell migration. One of these techniques we will now discuss in this tutorial.
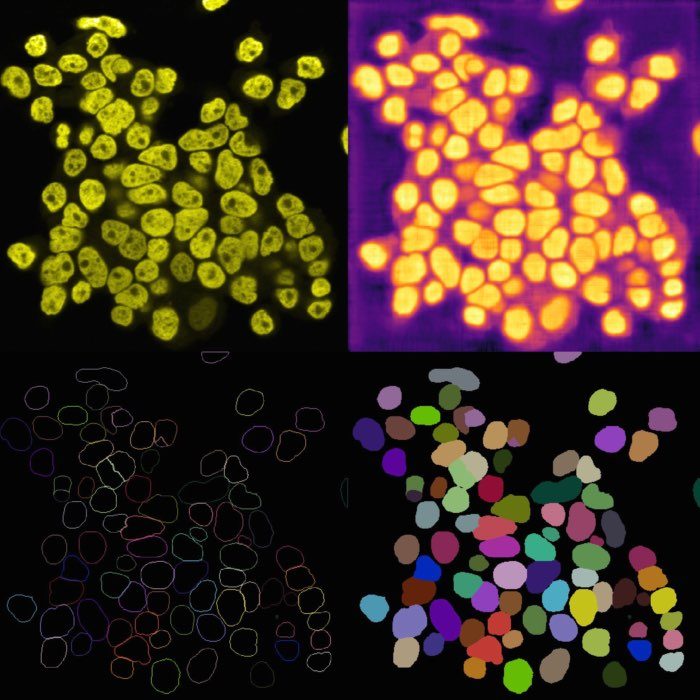
 Example of cell migration. Shown are migrating breast cancer cell from the “R1_cell migration R1 - Position 79_XY1562686175_Z0_T00_C1” TIFF file (image data taken from Jacquemet (2020)ꜛ, see image credits in the acknowledgements section below).
Tracking cell migration in Napari
We use the laptrack pluginꜛ, which is based on the LapTrack libraryꜛ (Fukai and Kawaguchi (2023)ꜛ). LapTrack provides a robust particle tracking algorithm, both in 2D+t and 3D+t, using the Linear Assignment Problem (LAP)ꜛ.
There are two prerequisites for using the plugin:
- If the data comes as a 2D+t stack and has not the shape
[t,1,y,x], it must be converted accordingly. Fortunately, the plugin will check and convert the data automatically. For a manual conversion, please use theConvert 3D stack to 2d+t timelapsefunction from theTools->Utilitiesmenu. The same accounts for 3D+t stacks. - The plugin assesses the segmentation mask of the actual image stack. Thus, we need to segment the stack with a suitable segmentation algorithm, e.g., by global thresholding methods, a Cellpose or StarDist, as described in the previous chapters.
When you have the segmentation layer, you can start tracking the objects. Open the plugin’s widget via Tools->Tracking->Track labeled objects (centroid-based, LapTrack), set the corresponding image and label layers accordingly, and hit Run:
 Example tracking for the “R1_cell migration R1 - Position 79_XY1562686175_Z0_T00_C1” image.
 Results of the tracking, showing the different output layer created by the plugin. Please note, that I have deleted the original image and label layer.
The plugin generates multiple new layer as well as results table:
- The “Tracks” layer, which visualizes the travel path of the labels’ centroids over time. This layer is a special Napari layer, read more about it in the Napari documentationꜛ.
- The 2d+t + Name… and the Labels layer, which are both the same as the input image layer, but converted as described in prerequisite 1.
- The Track-ID image, which is a label image where objects have the same label/color over time.
- The results table, which is in principle a feature table of the segmented objects, but with additional columns for the tracking results:
label,frameandtrack_id. All labels which belong to the same track, but to different frames, have the sametrack_id. The tables also contains the columnscentroid-0/1/2with the spatial positions of the labels. You can export the table as a CSV file for further analysis.

 The results table containing the extracted features of the detected objects in our image as well as additional columns for the tracking results:
 label, frame, track_id and centroid-0/1/2. All labels which belong to the same track, but to different frames, have the same track_id. The table can be exported as a CSV file for further analysis.
Further readings
- Guillaume Jacquemet (2020). Combining StarDist and TrackMate example 1 - Breast cancer cell dataset (Version 1) (Data set). Zenodo. doi.org/10.5281/zenodo.4034975ꜛ
- Napari hub page of the napari-laptrack pluginꜛ
- GitHub repository of the napari-laptrack pluginꜛ
- LapTrack libraryꜛ
- Yohsuke T Fukai, Kyogo Kawaguchi, LapTrack: linear assignment particle tracking with tunable metrics, Bioinformatics, Volume 39, Issue 1, January 2023, btac799, doi.org/10.1093/bioinformatics/btac799ꜛ
- Wikipedia article on the Linear Assignment Problem (LAP)ꜛ
- Napari documentation on the “Tracks” layerꜛ
- There are also other Napari plugins, which can be used for tracking, e.g.,
Acknowledgements
The image data file “R1_cell migration R1 - Position 79_XY1562686175_Z0_T00_C1” used in this tutorial is part of the Combining StarDist and TrackMate example 1 - Breast cancer cell dataset by Jacquemet (2020).